Copyright
©The Author(s) 2017.
World J Gastroenterol. Sep 7, 2017; 23(33): 6100-6110
Published online Sep 7, 2017. doi: 10.3748/wjg.v23.i33.6100
Published online Sep 7, 2017. doi: 10.3748/wjg.v23.i33.6100
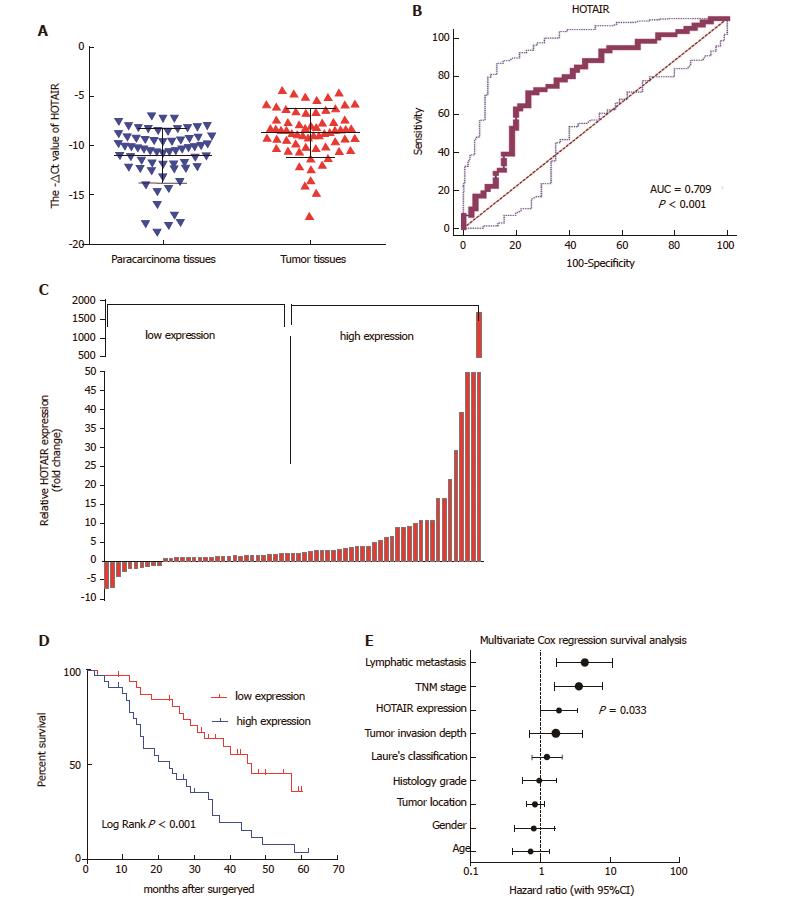
Figure 1 HOTAIR up-regulation correlates with poor survival in patients with GC.
A: HOTAIR expression was significantly up-regulated in tumor tissues compared with their corresponding para-carcinoma tissues (shown as -ΔCt); B: ROC curves for observing the diagnostic value of HOTAIR; C: HOTAIR expression was classified into two groups according to HOTAIR expression levels (median split); D: Kaplan-Meier analysis of OS was analyzed according to HOTAIR expression levels; E: Different factors (including HOTAIR, tumor invasion depth, lymph node metastasis, TNM stage, histological grade, gender, tumor location, Lauren’s classification and age) were analyzed for their association with patient survival using Cox regression model. The hazard ratio and 95%CI are plotted for each factor. CI: Confidence interval; GC: Gastric cancer; HOTAIR: HOX transcript antisense intergenic RNA; OS: Overall survival; ROC: Receiver operating characteristic; TNM: Tumor-node-metastasis.
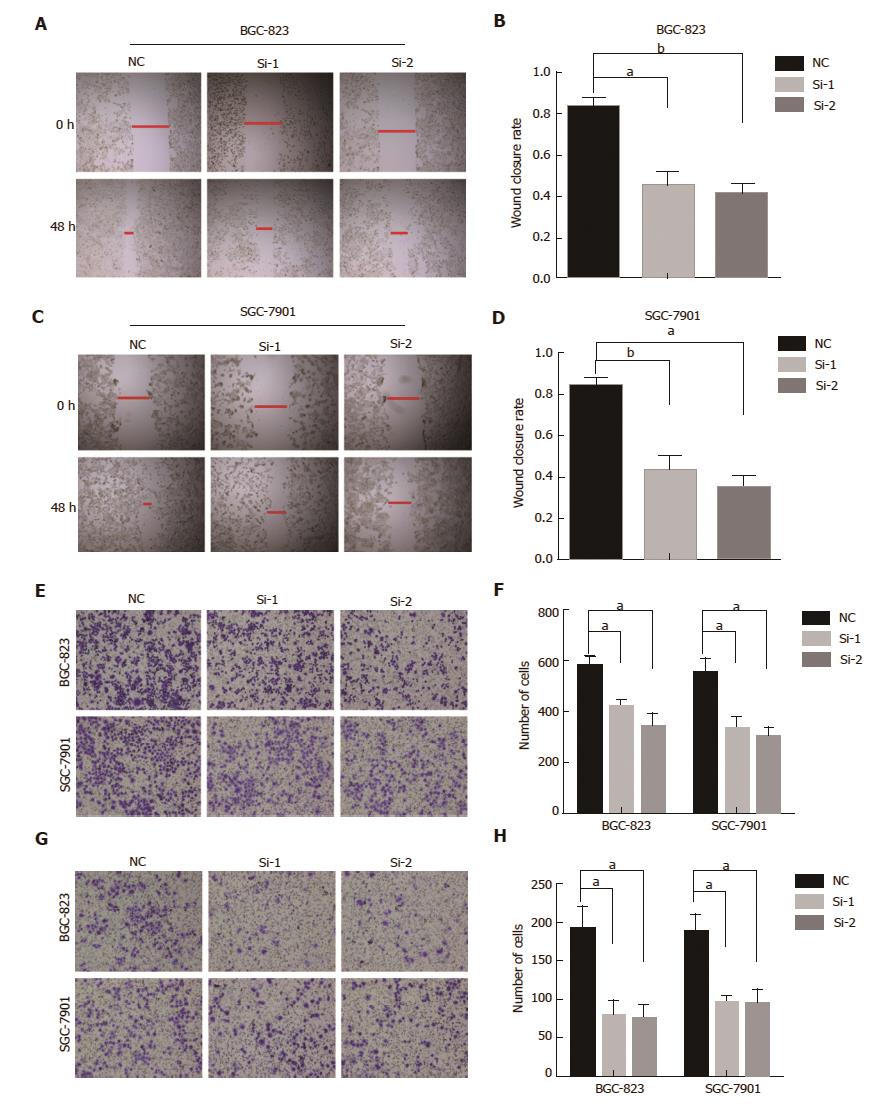
Figure 2 HOTAIR knockdown decreases migration and invasion of gastric cancerGC cells.
A and B: HOTAIR knockdown samples exhibited slower scratch closure rate by the wound-healing detection in BGC-823 cells; C and B: Wound-healing assay in SGC-7901 cells with HOTAIR silencing; E and F: Representative pictures of cell migration across the membrane in BGC-823 and SGC-7901 cells with HOTAIR reduction; G and H: Representative pictures of Transwell invasion assay in BGC-823 and SGC-7901 cells with HOTAIR depletion. (aP < 0.05, bP < 0.01). GC: Gastric cancer; HOTAIR: HOX transcript antisense intergenic RNA.
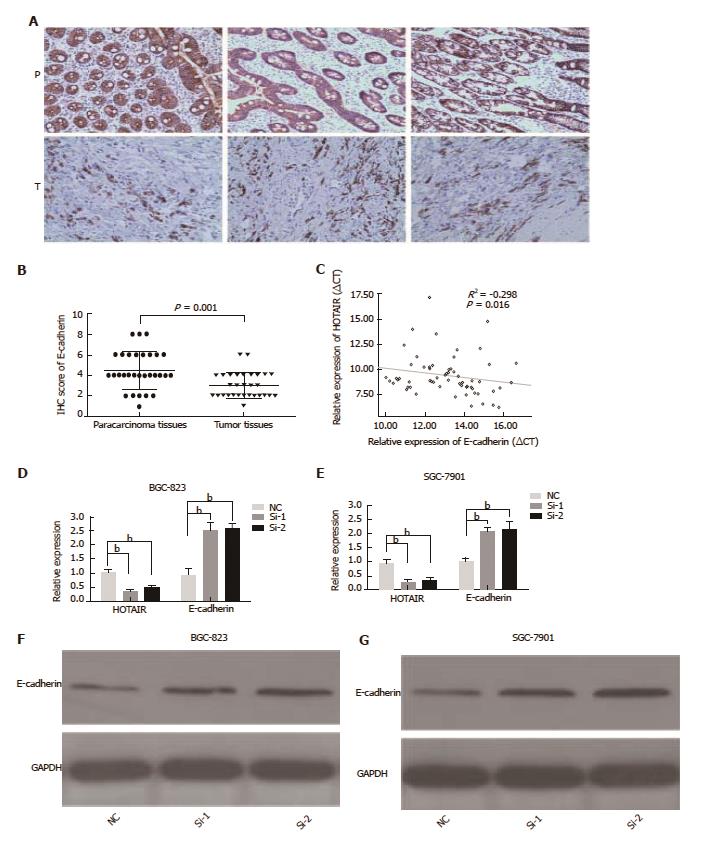
Figure 3 HOTAIR negatively correlates to E-cadherin expression in GC tissues and cell lines.
A: E-cadherin immunostaining in para-carcinoma tissues (denoted as ‘P’) and GC tissues (denoted as ‘T’); B: Representative E-cadherin protein levels and scores in GC tissues and para-carcinoma tissues was analyzed by immunohistochemistry (n = 30); C: Negative correlation between E-cadherin mRNA levels and HOTAIR levels in 65 GC samples; D, E: Relative expression of HOTAIR and E-cadherin in BGC-823 and SGC-7901 cells treated with siRNA for 48 h; F, G: Western blot analysis of E-cadherin after HOTAIR-siRNA (Si1 and Si2) treatment for 48 h in BGC-823 and SGC-7901 cells. aP < 0.05, bP < 0.01. GC: Gastric cancer; HOTAIR: HOX transcript antisense intergenic RNA; si: Small interfering.
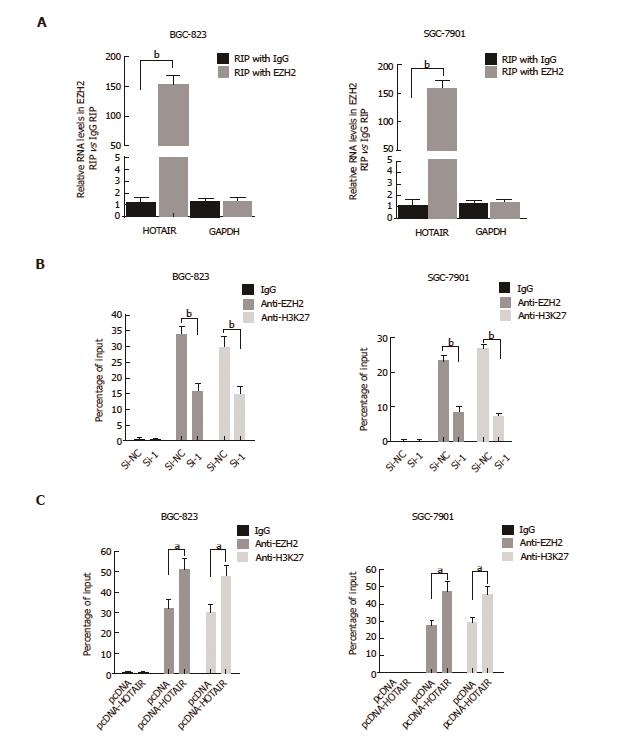
Figure 4 HOTAIR represses E-cadherin expression by associating with EZH2.
A: RIP experiments were performed in BGC-823 and SGC-7901 cells, and HOTAIR levels were analyzed in co-precipitated RNA using qPCR. The fold-enrichment of HOTAIR in EZH2 RIP is relative to its matching IgG control RIP (aP < 0.05, bP < 0.01); B: ChIP of EZH2 and H3K27me3 in the E-cadherin promoter regions after siRNA treatment targeting si-NC or HOTAIR-siRNA-1 in BGC-823 and SGC-7901 cells. qPCR was performed to quantify ChIP assay results. Enrichment was quantified relative to input controls. Antibody directed against IgG was used as a negative control. Results are represented as the average ± SD based on three independent experiments. aP < 0.05, bP < 0.01; C: ChIP of EZH2 and H3K27me3 in the E-cadherin promoter regions after transfected with empty vector (denoted as ‘pcDNA’) or pcDNA-HOTAIR in BGC-823 and SGC-7901 cells. qPCR was performed to quantify ChIP assay results. Enrichment was quantified relative to input controls. Results are represented as the average ± SD based on three independent experiments (aP < 0.05, bP < 0.01). ChIP: Chromatin immunoprecipitation; GC: Gastric cancer; HOTAIR: HOX transcript antisense intergenic RNA; qPCR: Quantitative polymerase chain reaction; RIP: RNA-binding protein immunoprecipitation; SD: Standard deviation; si: Small interfering.
- Citation: Chen WM, Chen WD, Jiang XM, Jia XF, Wang HM, Zhang QJ, Shu YQ, Zhao HB. HOX transcript antisense intergenic RNA represses E-cadherin expression by binding to EZH2 in gastric cancer. World J Gastroenterol 2017; 23(33): 6100-6110
- URL: https://www.wjgnet.com/1007-9327/full/v23/i33/6100.htm
- DOI: https://dx.doi.org/10.3748/wjg.v23.i33.6100


