Copyright
©The Author(s) 2017.
World J Gastroenterol. Aug 28, 2017; 23(32): 5895-5903
Published online Aug 28, 2017. doi: 10.3748/wjg.v23.i32.5895
Published online Aug 28, 2017. doi: 10.3748/wjg.v23.i32.5895
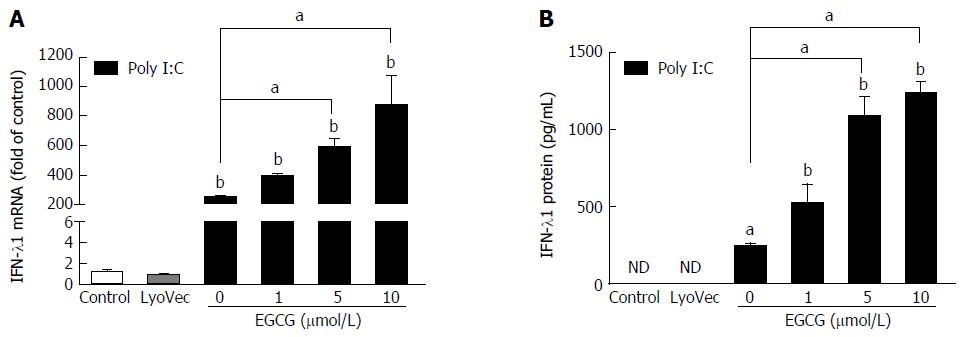
Figure 1 (-)-Epigallocatechin-3-gallate enhances poly I:C-induced interferon-λ1 expression in JFH-1-Huh7 cells.
JFH-1-infected Huh7 cells (72 h post-infection) were treated with EGCG at the indicated concentrations for 1 h prior to poly I:C (1 μg/mL) stimulation. Total RNA extracted from cells after 24 h of stimulation was subjected to real-time reverse transcription-polymerase chain reaction for the determination of IFN-λ1 and glyceraldehyde-3-phosphate dehydrogenase mRNA levels. The data are expressed as IFN-λ1 mRNA (A) levels relative (fold) to the control (vehicle only, which is defined as 1). After 48 h of stimulation, the supernatant (SN) was collected from the cell cultures for the determination of IFN-λ1 protein levels by enzyme-linked immunosorbent assay (B). The results shown are the mean ± SD of triplicate measurements representative of three experiments (Poly I:C vs LyoVec, aP < 0.05, bP < 0.01). IFN: Interferon; EGCG: (-)-Epigallocatechin-3-gallate.
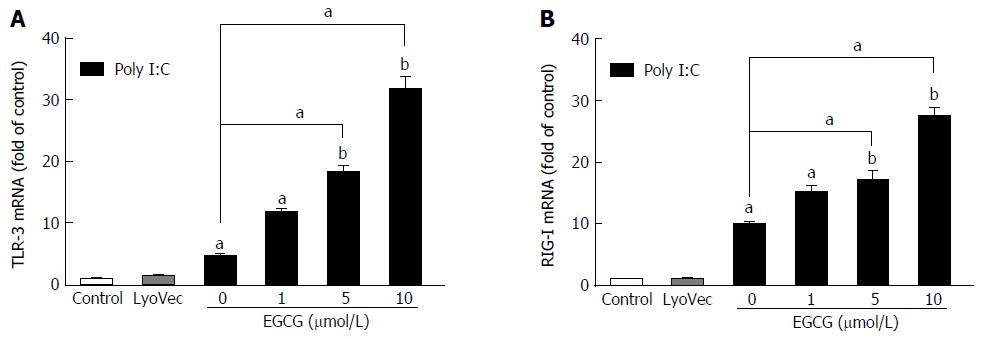
Figure 2 (-)-Epigallocatechin-3-gallate increases poly I:C-induced TLR3 and RIG-I mRNA expression in JFH-1-infected Huh7 cells.
JFH-1-infected Huh7 cells (72 h post-infection) were treated with (-)-epigallocatechin-3-gallate (EGCG) at the indicated concentrations for 1 h prior to poly I:C (1 μg/mL) stimulation. Total RNA extracted from the cells after 24 h of stimulation was evaluated for TLR3 (A) and RIG-I (B) gene expression by real-time RT-PCR. The results shown are the mean ± SD of triplicate measurements representative of three experiments (Poly I:C vs LyoVec, aP < 0.05, bP < 0.01). TLR3: Toll-like receptor 3; RIG-I: Retinoic acid-inducible gene I.
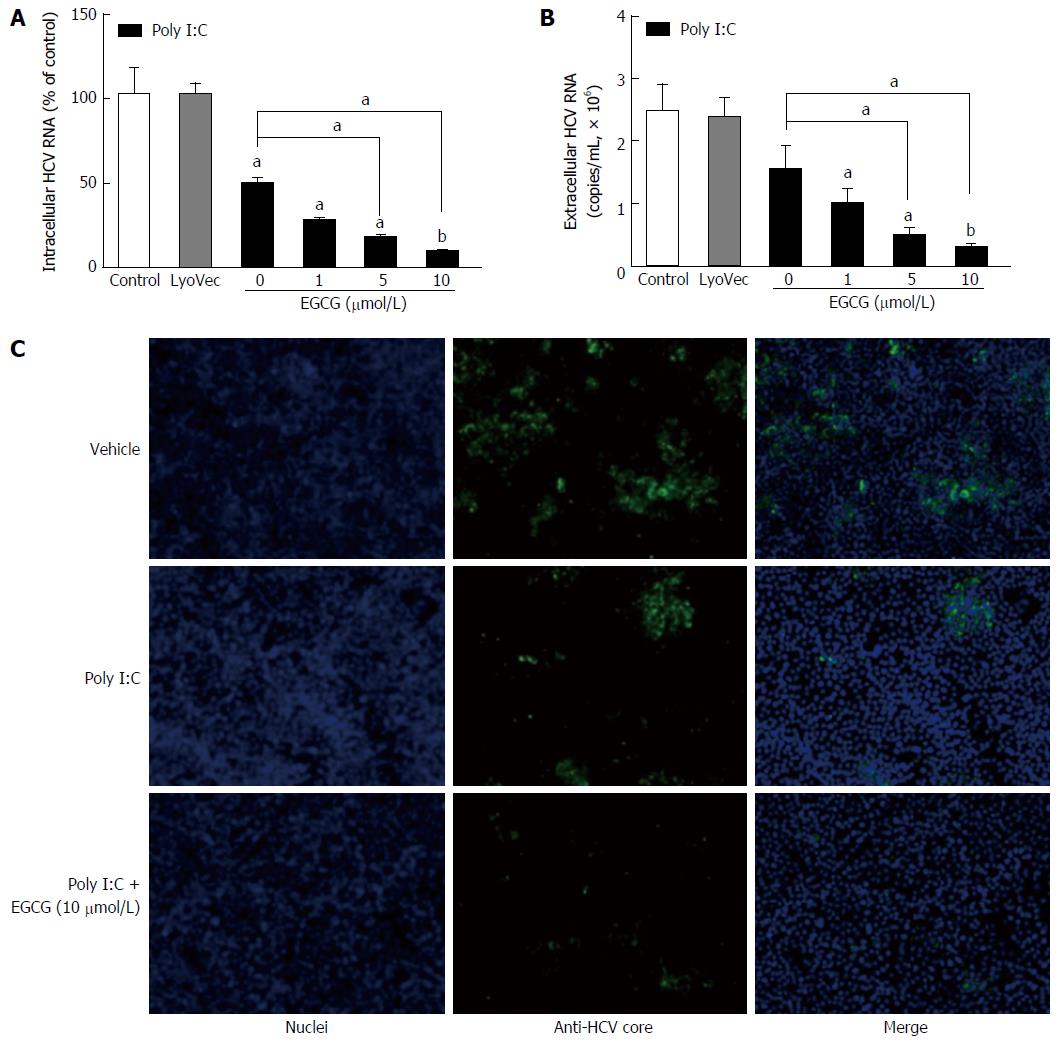
Figure 3 (-)-Epigallocatechin-3-gallate contributes to poly I:C-mediated inhibition of hepatitis C virus replication.
JFH-1-infected Huh7 cells (72 h post-infection) were treated with EGCG at the indicated concentrations for 1 h prior to poly I:C (1 μg/mL) stimulation. Intracellular (A) and extracellular (B) RNA was extracted from the JFH-1-infected Huh7 cells or culture SN after 48 h of stimulation and subjected to real-time reverse transcription-polymerase chain reaction for HCV and GAPDH RNA quantification. The intracellular hepatitis C virus (HCV) RNA level is expressed as the HCV RNA level relative (%) to the control (vehicle only, which is defined as 100%). Extracellular RNA levels are expressed as copies/mL. The results shown are the mean ± SD of triplicate cultures representative of three experiments (Poly I:C vs LyoVec, aP < 0.05, bP < 0.01). HCV core protein expression (C) was determined by immunofluorescence staining with an antibody against the HCV core protein (green) after 48 h of stimulation. The nuclei were stained with Hoechst 33342 (blue). One representative experiment is shown (original magnification: × 200). EGCG: (-)-Epigallocatechin-3-gallate.
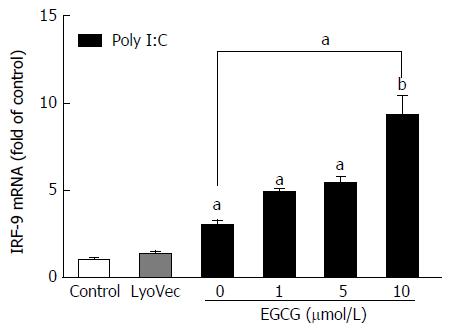
Figure 4 (-)-Epigallocatechin-3-gallate increases poly I:C-induced IRF-9 expression in JFH-1-Huh7 cells.
JFH-1-infected Huh7 cells (72 h post-infection) were treated with EGCG at the indicated concentrations for 1 h prior to poly I:C (1 μg/mL) stimulation. Total RNA extracted from the cells after 24 h of stimulation was subjected to real-time reverse transcription-polymerase chain reaction for the analysis of IRF-9 gene expression. The results shown are the mean ± SD of triplicate measurements representative of three experiments (Poly I:C vs LyoVec, aP < 0.05, bP < 0.01). EGCG: (-)-Epigallocatechin-3-gallate.
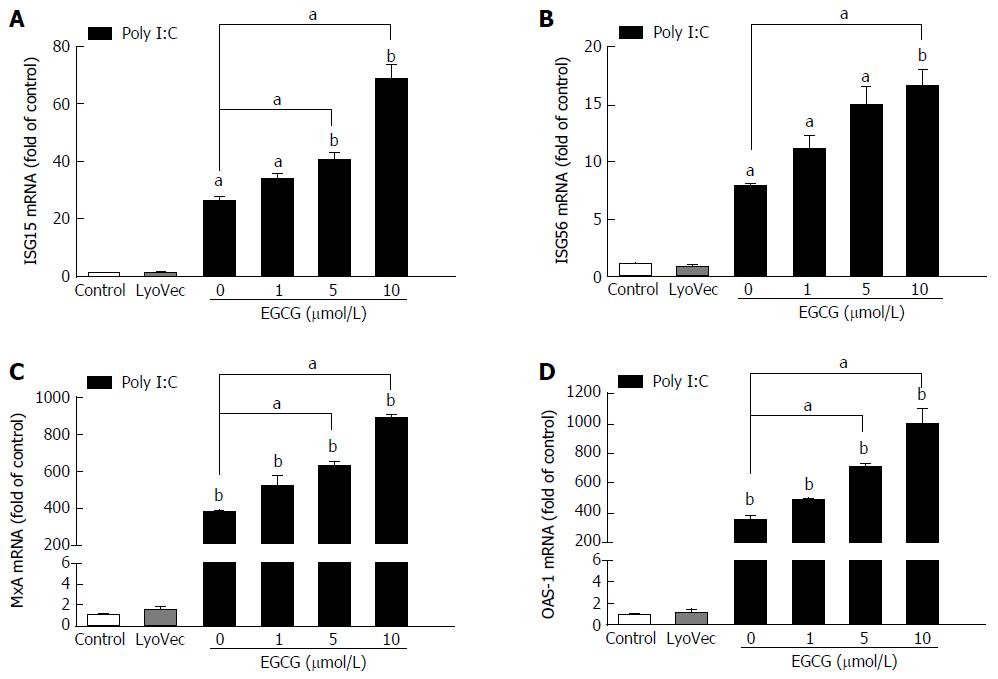
Figure 5 Effect of (-)-epigallocatechin-3-gallate on poly I:C-induced ISGs expression in JFH-1-infected Huh7 cells.
JFH-1-infected Huh7 cells (72 h post-infection) were treated with EGCG at the indicated concentrations for 1 h prior to poly I:C (1 μg/mL) stimulation. Total RNA extracted from the cells after 24 h of stimulation was subjected to real-time reverse transcription-polymerase chain reaction for the determination of ISG and glyceraldehyde-3-phosphate dehydrogenase mRNA levels. The data are expressed as ISG15 (A), ISG56 (B), MxA (C), and OAS-1 (D) mRNA levels relative (fold) to the control (vehicle only, which is defined as 1). The results shown are the mean ± SD of triplicate measurements representative of three experiments (Poly I:C vs LyoVec, aP < 0.05, bP < 0.01). EGCG: (-)-Epigallocatechin-3-gallate.
- Citation: Wang YZ, Li JL, Wang X, Zhang T, Ho WZ. (-)-Epigallocatechin-3-gallate enhances poly I:C-induced interferon-λ1 production and inhibits hepatitis C virus replication in hepatocytes. World J Gastroenterol 2017; 23(32): 5895-5903
- URL: https://www.wjgnet.com/1007-9327/full/v23/i32/5895.htm
- DOI: https://dx.doi.org/10.3748/wjg.v23.i32.5895


