Copyright
©The Author(s) 2017.
World J Gastroenterol. Aug 14, 2017; 23(30): 5602-5609
Published online Aug 14, 2017. doi: 10.3748/wjg.v23.i30.5602
Published online Aug 14, 2017. doi: 10.3748/wjg.v23.i30.5602
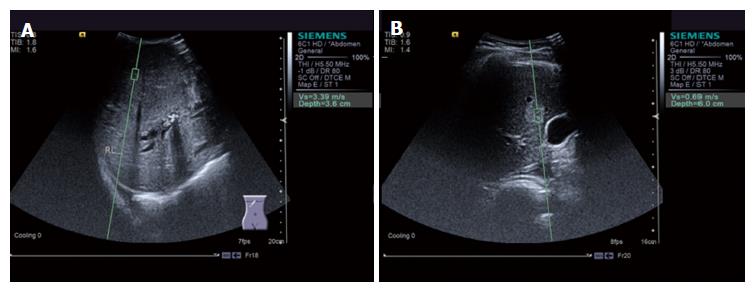
Figure 1 Acoustic radiation force impulse imaging of a liver tumor.
A: Acoustic radiation force impulse (ARFI) detection of a malignant liver tumor [shear wave velocity (SWV) = 3.39 m/s]; B: ARFI detection of a benign liver tumor (SWV = 0.69 m/s).
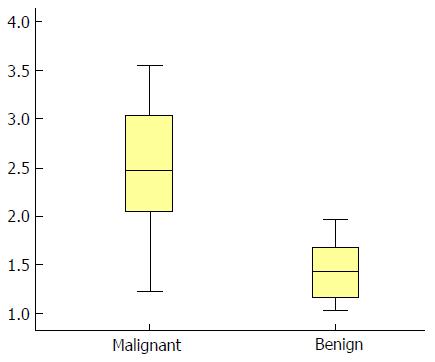
Figure 2 Shear wave velocity values of the malignant and benign tumor groups.
The shear wave velocity of malignant tumors was 2.39 ± 1.20 m/s, while that of benign tumors was 1.50 ± 0.49 m/s.
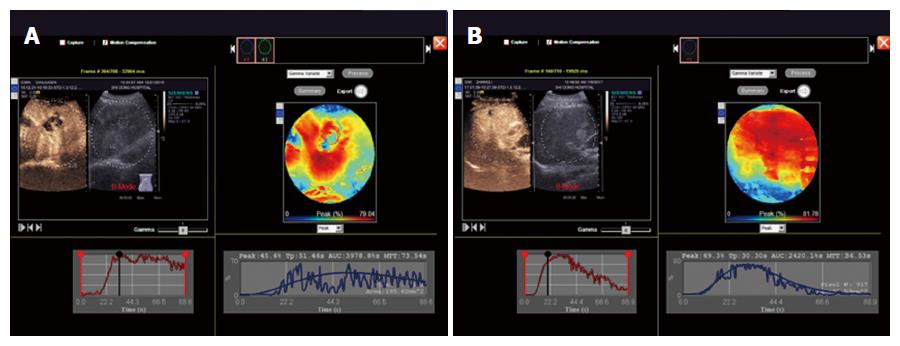
Figure 3 Contrast-enhanced ultrasound TIC curves used to detect benign and malignant liver tumors.
A: TIC curve for the detection of malignant liver tumors; B: TIC curve for the detection of benign liver tumors.
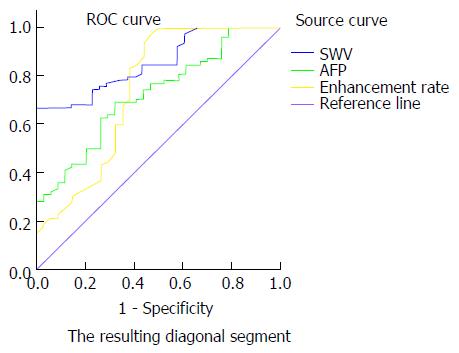
Figure 4 Comparison of the receiver operating characteristic curves of shear wave velocity, alpha-fetoprotein and enhancement rate for the identification of benign and malignant liver tumors.
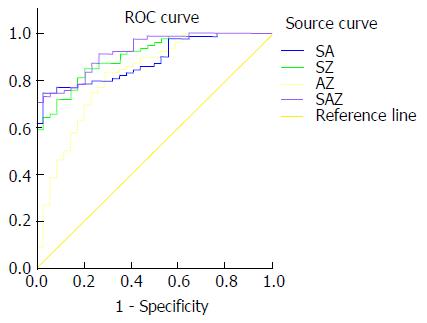
Figure 5 Comparison of the receiver operating characteristic curves of the combination of shear wave velocity value, alpha-fetoprotein content and enhancement rate for identifying benign and malignant liver tumors.
SA = SWV value + AFP content; SZ = SWV value + enhancement rate; AZ = AFP content + enhancement rate; SAZ = SWV value + AFP content + enhancement rate.
- Citation: Sun XL, Yao H, Men Q, Hou KZ, Chen Z, Xu CQ, Liang LW. Combination of acoustic radiation force impulse imaging, serological indexes and contrast-enhanced ultrasound for diagnosis of liver lesions. World J Gastroenterol 2017; 23(30): 5602-5609
- URL: https://www.wjgnet.com/1007-9327/full/v23/i30/5602.htm
- DOI: https://dx.doi.org/10.3748/wjg.v23.i30.5602


