Copyright
©The Author(s) 2017.
World J Gastroenterol. Aug 14, 2017; 23(30): 5579-5588
Published online Aug 14, 2017. doi: 10.3748/wjg.v23.i30.5579
Published online Aug 14, 2017. doi: 10.3748/wjg.v23.i30.5579
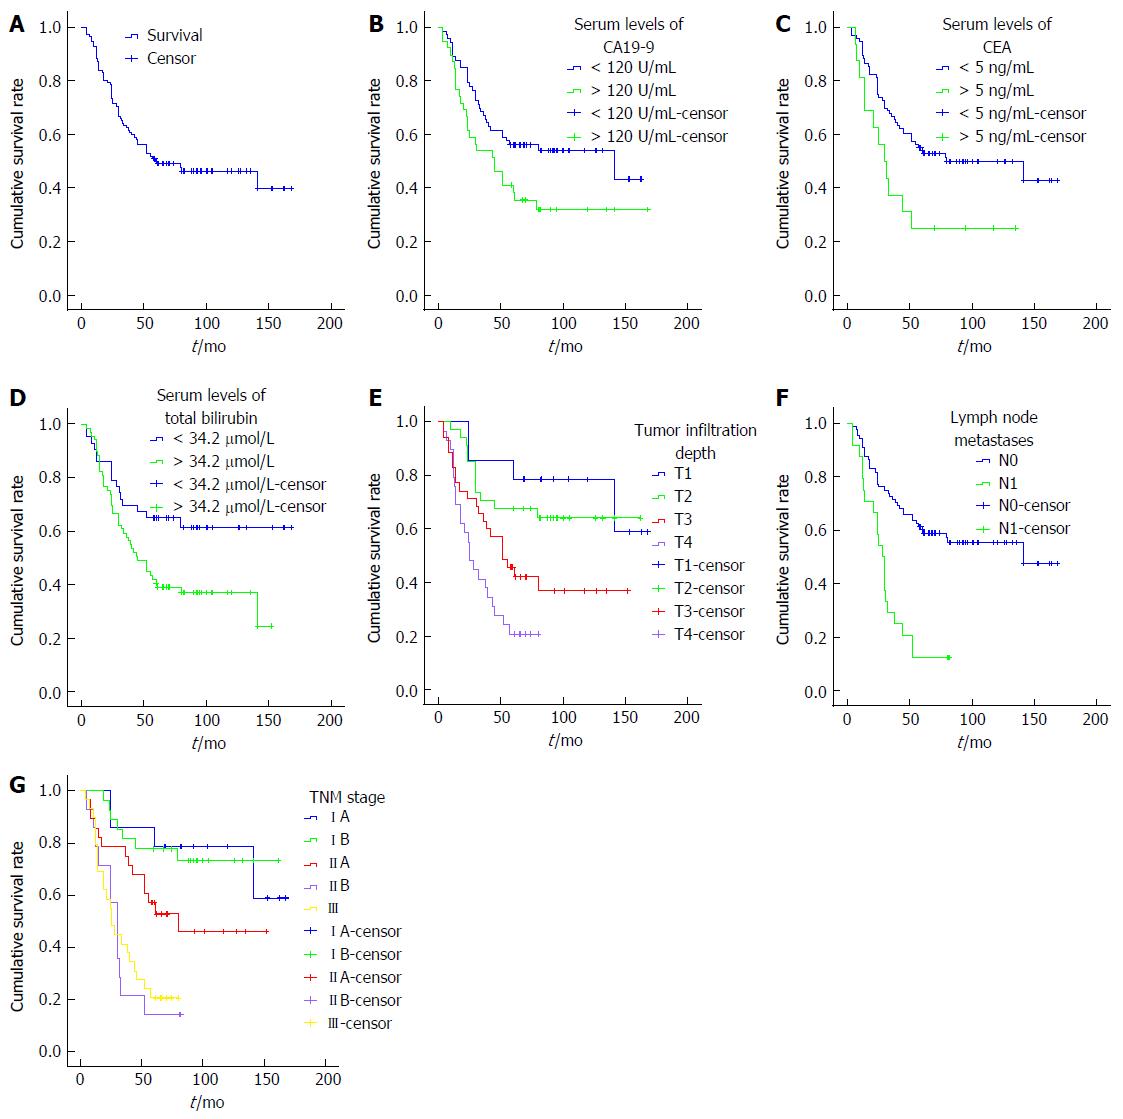
Figure 1 Kaplan-Meier plots show the association of survival and significant factors.
A: The overall 5-year survival was 50.00%, with a median follow-up of 60 mo (ranging from 4 mo to 168 mo); B: Increased serum levels of CA19-9 was associated with decreased survival (P = 0.033); C: Increased serum levels of CEA was associated with decreased survival (P = 0.018); D: Increased serum levels of total bilirubin was associated with decreased survival (P = 0.015); E: The senior grade of infiltration depth was associated with decreased survival (P = 0.000), with significant difference between T1 and T3, T4 (P = 0.022, 0.000), as well as the difference between T2 and T3, T4 (P = 0.036, 0.000) and the difference between T3 and T4 (P = 0.049); F: The senior grade of lymph node metastases was associated with decreased survival (P = 0.000); G: TNM stage was associated with decreased survival (P = 0.000), with significant difference between IA and IIB, III (P = 0.000, 0.000), as well as the difference between IB and IIB, III (P = 0.000, 0.000) and the difference between IIA and IIB, III (P = 0.006, 0.000).
- Citation: Lian PL, Chang Y, Xu XC, Zhao Z, Wang XQ, Xu KS. Pancreaticoduodenectomy for duodenal papilla carcinoma: A single-centre 9-year retrospective study of 112 patients with long-term follow-up. World J Gastroenterol 2017; 23(30): 5579-5588
- URL: https://www.wjgnet.com/1007-9327/full/v23/i30/5579.htm
- DOI: https://dx.doi.org/10.3748/wjg.v23.i30.5579


