Copyright
©The Author(s) 2017.
World J Gastroenterol. Aug 7, 2017; 23(29): 5333-5344
Published online Aug 7, 2017. doi: 10.3748/wjg.v23.i29.5333
Published online Aug 7, 2017. doi: 10.3748/wjg.v23.i29.5333
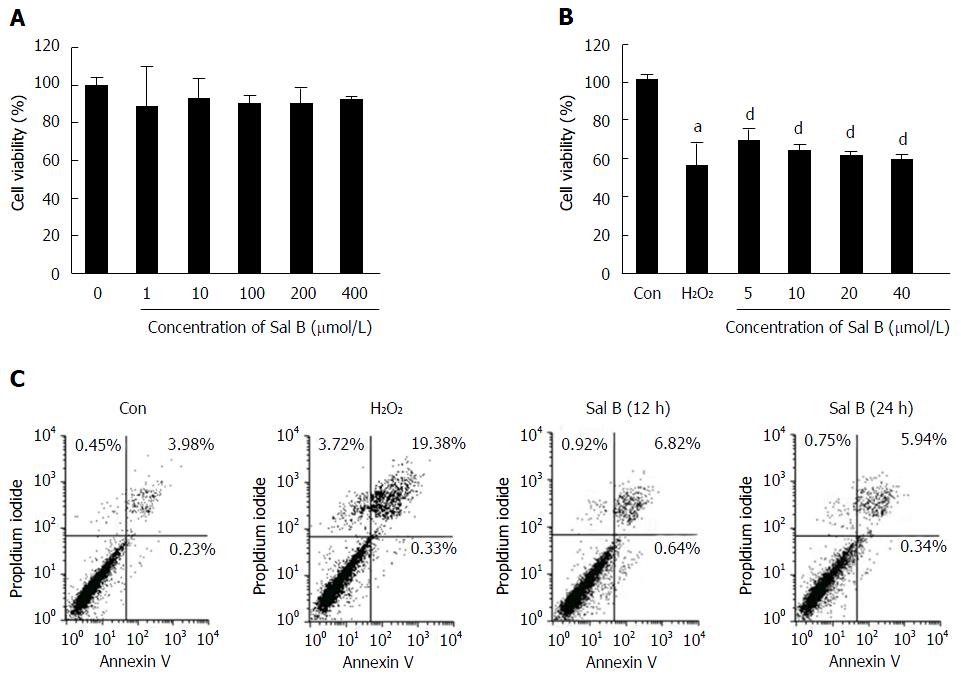
Figure 1 Effect of Sal B on apoptosis and death.
A: The viability of hepatocytes treated with different concentrations of Sal B for 24 h; B: The viability of hepatocytes treated with different concentrations of Sal B for 22 h following induction by H2O2 for 2 h; C: The Annexin V/PI assay with FACS. All data are presented as mean ± SD. Statistical analysis was performed using Student’s t-test (aP < 0.05 vs Con; dP < 0.01 vs H2O2).
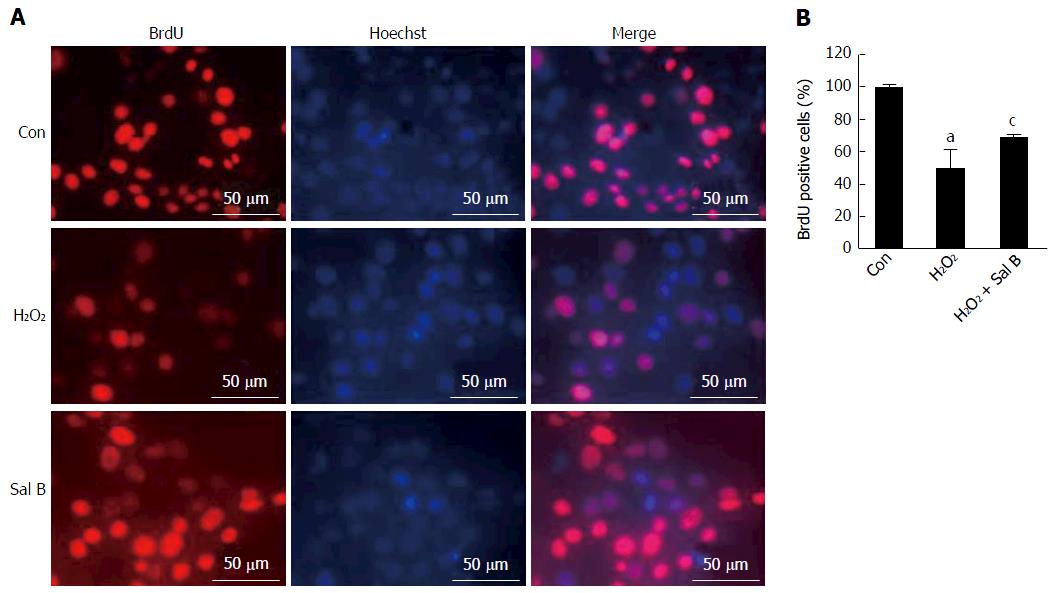
Figure 2 Effect of Sal B on cell proliferation.
A: BrdU incorporation assay, with 4000 cells seeded in a 96-well plate being treated with 10 μmol/L of Sal B for 24 h and with 500 μmol/L H2O2 for an additional 2 h. A final concentration of 10 μmol/L BrdU was supplemented in the medium for 24 h (scale bar = 50 μmol/L); B: Quantification of BrdU incorporation assay. All data are presented as mean ± SD. Statistical analysis was performed using Student’s t-test (aP < 0.05 vs Con; cP < 0.05 vs H2O2).
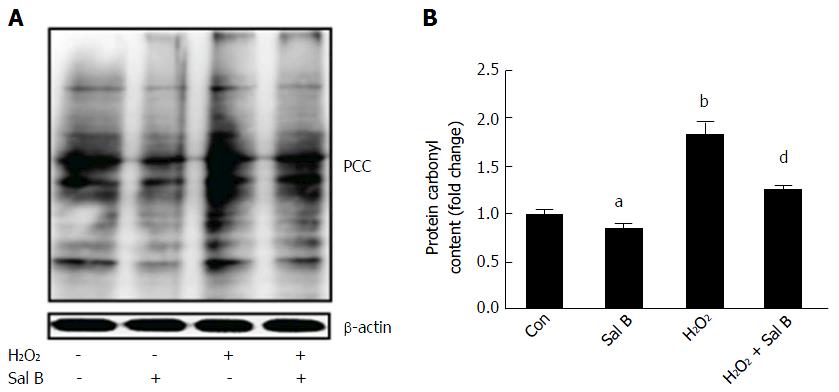
Figure 3 Effect of Sal B on protein carbonyl content.
A: The expressions of protein carbonyl content in hepatocytes detected by western blot; B: Quantitative analysis of optical densities of protein carbonyl content and normalized to the expression of β-actin (aP < 0.05, bP < 0.01 vs Con; dP < 0.01 vs H2O2).
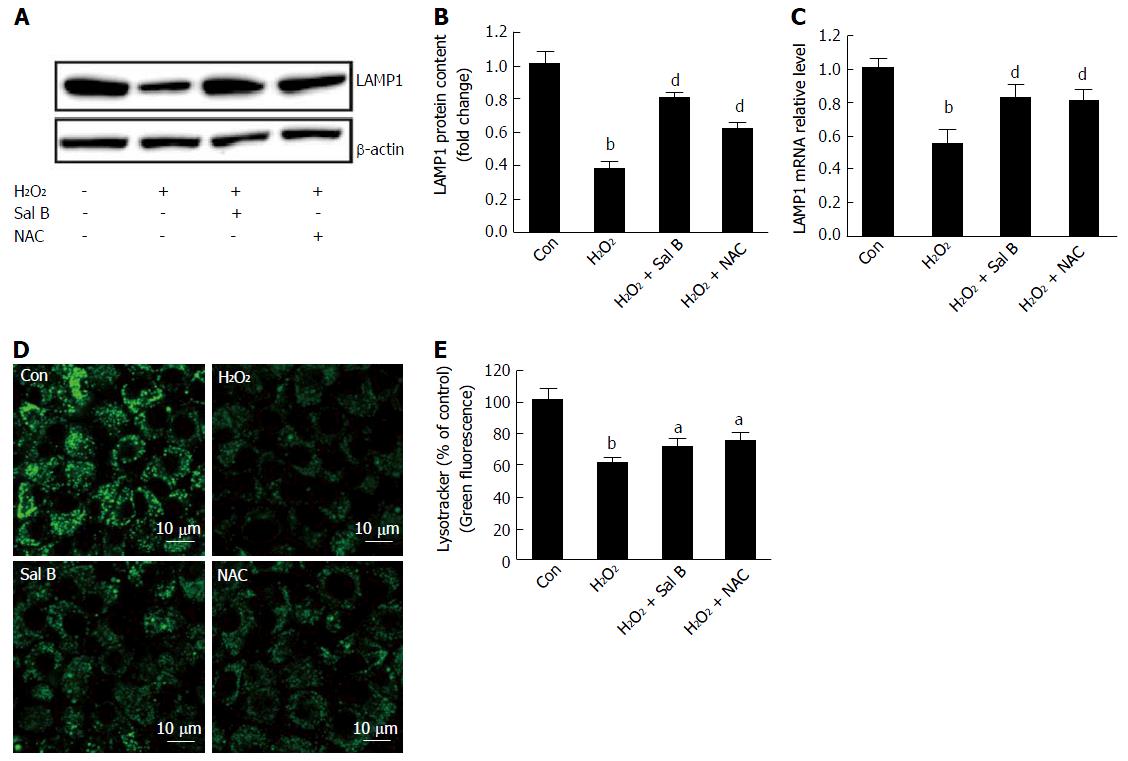
Figure 4 Effect of Sal B on lysosomal membrane permeability.
A: The expressions of LAMP1 in hepatocytes detected by western blot; B: Quantitative analysis of optical densities of LAMP1 and normalized to the expression of β-actin; C: Levels of LAMP1 mRNA were measured in cells by qRT-PCR; D: LysoTracker green staining; E: Quantification of the LysoTracker green staining (bP < 0.01 vs Con; aP < 0.05, dP < 0.01 vs H2O2).
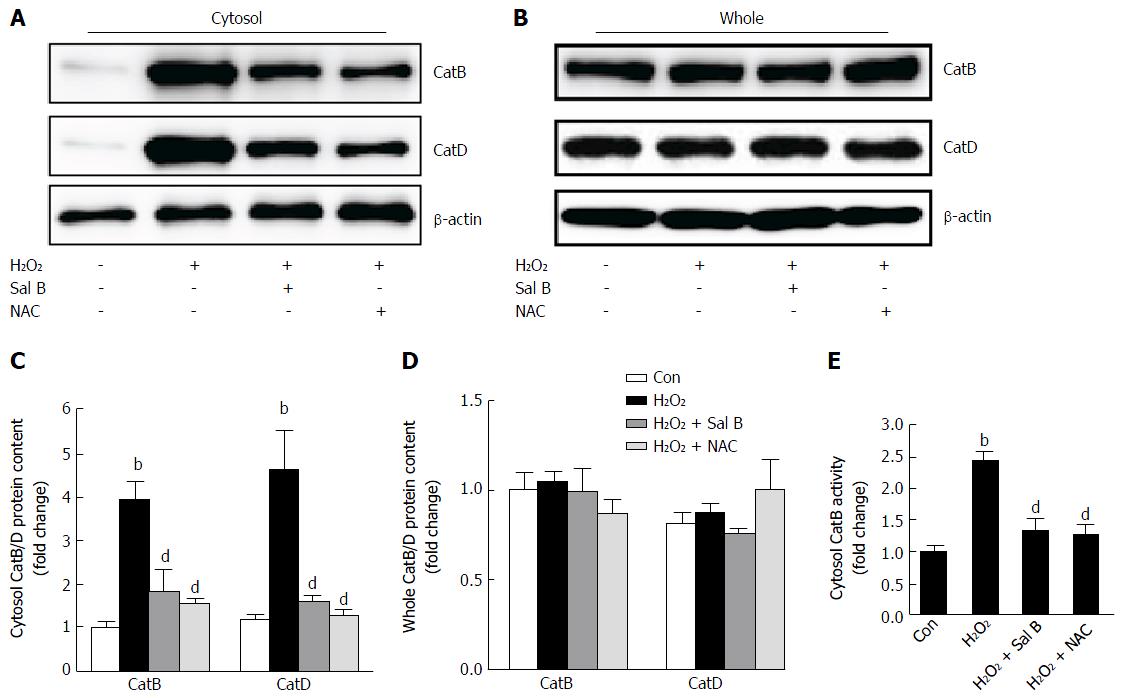
Figure 5 Effect of Sal B on the leakage of CatB/D into the cytosol.
A and B: CatB/D levels in the cytosol/whole lysate were measured by western blot; C and D: Quantitative analysis of optical densities of CatB/D in the cytosol/whole lysate and normalized to the expression of β-actin; E: CatB activity analysis was performed with chemiluminescence detection. (bP < 0.01 vs Con; dP < 0.01 vs H2O2).
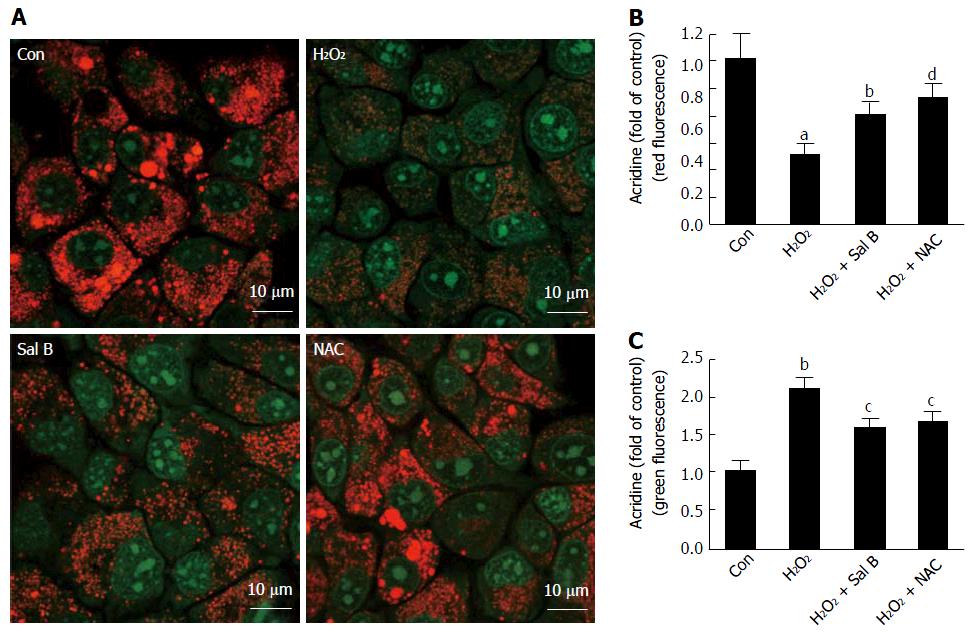
Figure 6 Effect of Sal B on lysosomal PH.
A: AO staining; B: Quantification of the AO staining (aP < 0.05, bP < 0.01 vs Con; cP < 0.05, dP < 0.01 vs H2O2).
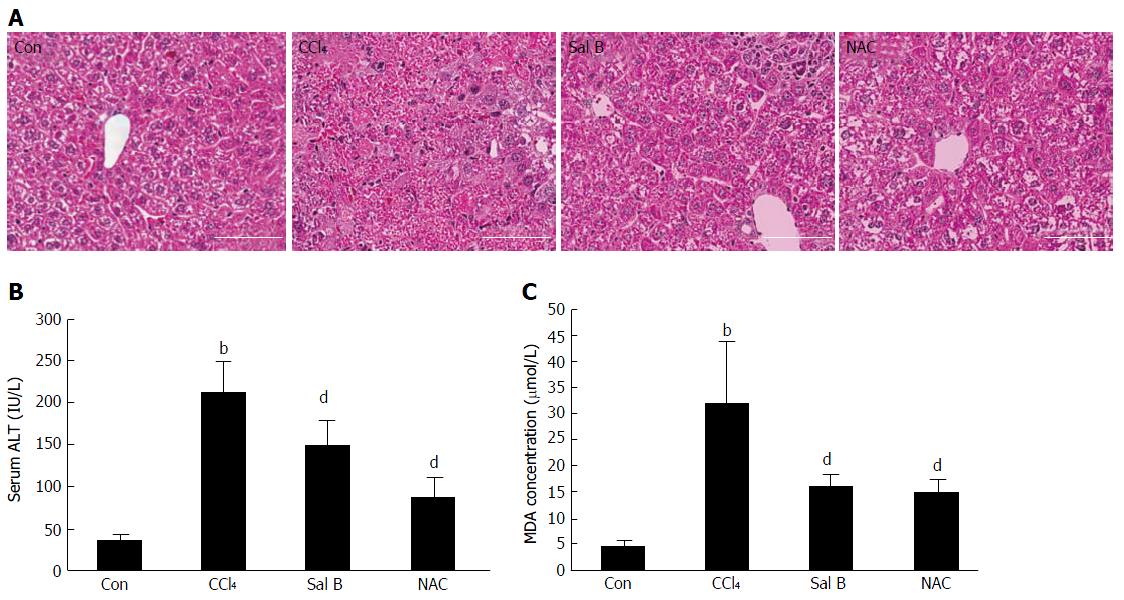
Figure 7 Effect of Sal B on CCl4-induced liver injury.
A: Hematoxylin-eosin staining is shown (scale bar =100 μm). Con:control group (n = 6), CCl4: CCl4 injection group (n = 6), Sal B: CCl4 injection and Sal B administration group (n = 6), NAC: CCl4 injection and NAC administration group (n = 6); B: Serum ALT activity in mice; C: MDA content of liver tissues in mice. Statistical analysis was performed using Student’s t-test (bP < 0.01 vs Con; dP < 0.01 vs CCl4). ALT: Alanine aminotransferase; MDA: Malondialdehyde.
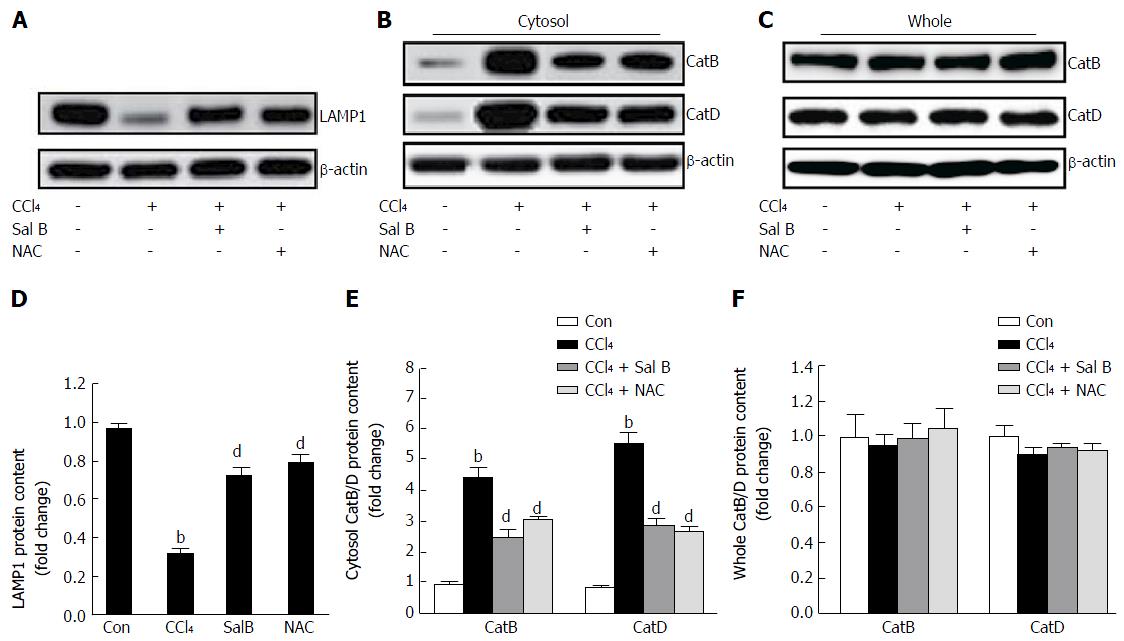
Figure 8 Effect of Sal B on LAMP1 and leakage of CatB to the cytosol.
A: Expressions of LAMP1 in liver detected by western blot; B, C: CatB/D levels in the cytosol/whole lysate were measured by western blot; D: Quantitative analysis of optical densities of LAMP1 and normalized to the expression of β-actin. E, F: Quantitative analysis of optical densities of CatB/D in the cytosol/whole lysate and normalized to the expression of β-actin. All data are presented as mean ± SD. Statistical analysis was performed using Student’s t-test (bP < 0.01 vs Con; dP < 0.01 vs CCl4).
- Citation: Yan XF, Zhao P, Ma DY, Jiang YL, Luo JJ, Liu L, Wang XL. Salvianolic acid B protects hepatocytes from H2O2 injury by stabilizing the lysosomal membrane. World J Gastroenterol 2017; 23(29): 5333-5344
- URL: https://www.wjgnet.com/1007-9327/full/v23/i29/5333.htm
- DOI: https://dx.doi.org/10.3748/wjg.v23.i29.5333


