Copyright
©The Author(s) 2017.
World J Gastroenterol. Aug 7, 2017; 23(29): 5304-5312
Published online Aug 7, 2017. doi: 10.3748/wjg.v23.i29.5304
Published online Aug 7, 2017. doi: 10.3748/wjg.v23.i29.5304
Figure 1 Gross presentation of celecoxib-induced gastric lesions at 48 h.
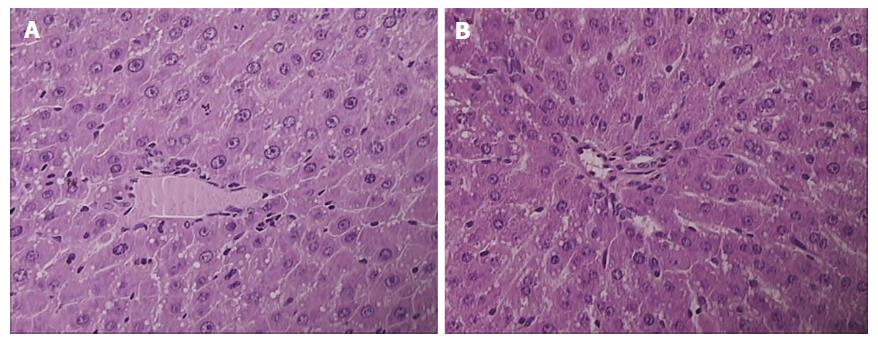
Figure 2 Presentation of celecoxib-induced liver lesions at 48 h.
Controls presented with pronounced microvesicullar and macrovesicullar steatosis, dilated sinusoids, and piecemeal necrosis (A); BPC 157 rats presenting with minimal microvesicullar steatosis and no necrosis (B). HE × 40.
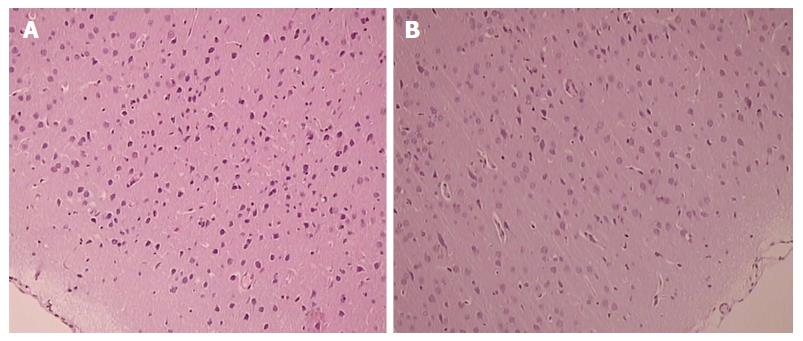
Figure 3 Presentation of celecoxib-induced cerebral cortex lesions at 48 h.
Control celecoxib rats presented more damaged (balloonized) red neurons without any inflammation markedly expressed in particular in the cerebral cortex (A), unlike BPC 157 + celecoxib rats (B). HE × 40.
- Citation: Drmic D, Kolenc D, Ilic S, Bauk L, Sever M, Zenko Sever A, Luetic K, Suran J, Seiwerth S, Sikiric P. Celecoxib-induced gastrointestinal, liver and brain lesions in rats, counteraction by BPC 157 or L-arginine, aggravation by L-NAME. World J Gastroenterol 2017; 23(29): 5304-5312
- URL: https://www.wjgnet.com/1007-9327/full/v23/i29/5304.htm
- DOI: https://dx.doi.org/10.3748/wjg.v23.i29.5304


