Copyright
©The Author(s) 2017.
World J Gastroenterol. Jul 28, 2017; 23(28): 5146-5157
Published online Jul 28, 2017. doi: 10.3748/wjg.v23.i28.5146
Published online Jul 28, 2017. doi: 10.3748/wjg.v23.i28.5146
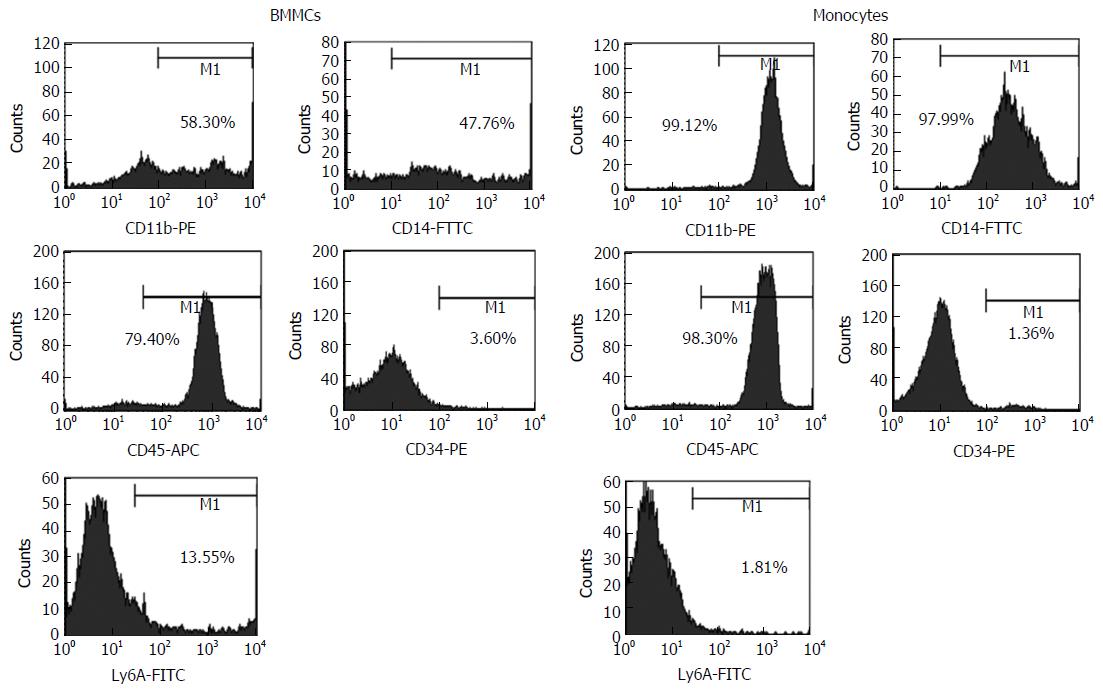
Figure 1 Representative FACS histograms of bone marrow mononuclear cells and CD11b+ monocytes isolated by immunomagnetic separation.
BMMCs: Bone marrow mononuclear cells.
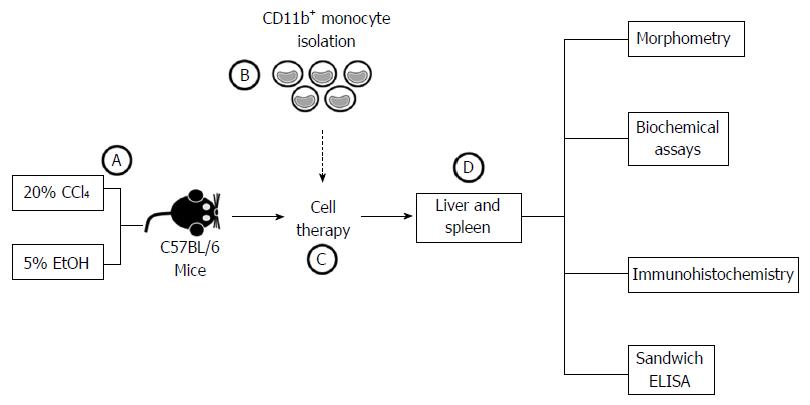
Figure 2 Schematic flowchart of experimental design.
A: Male C57BL/6 mice underwent chronic administration of CCl4 and EtOH solutions for 6 mo; B: Bone marrow mononuclear cells were harvested from C57BL/6 donor mice for CD11b+ monocyte isolation using immunomagnetic separation; C: Chronically liver-damaged mice underwent cell therapy; D: After 2 mo, effects of the treatment were evaluated using morphometric, biochemical, immunohistochemistry and sandwich ELISA analysis.
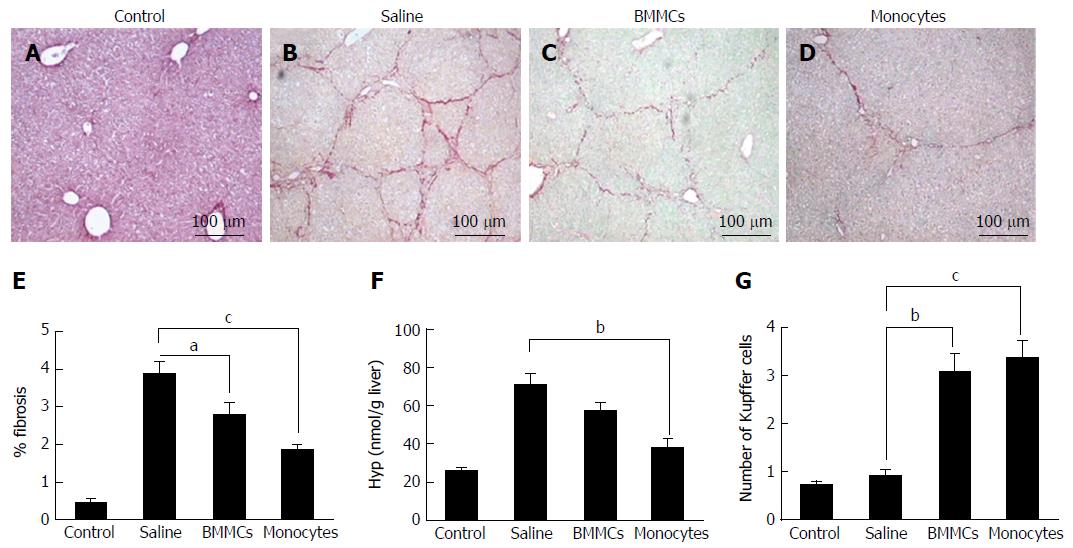
Figure 3 Photomicrographs of histological liver sections stained with picro-Sirius red.
A-D: The figure shows hepatic collagens in (A) control mice, mice after CCl4 administration and treatment with (B) saline, (C) BMMCs and (D) BMMC-derived monocytes (picro-Sirius red; magnification × 100); E: Morphometric evaluation of picro-Sirius Red-stained sections; F: Hydroxyproline in liver fragments of mice undergoing cell transplantation; G: Kupffer cell count in hematoxylin-eosin-stained histological liver sections from mice who underwent CD11b+CD14+ monocyte therapy and BMMC-treated mice. aP < 0.05; bP < 0.01; cP < 0.001. BMMCs: Bone marrow mononuclear cells.
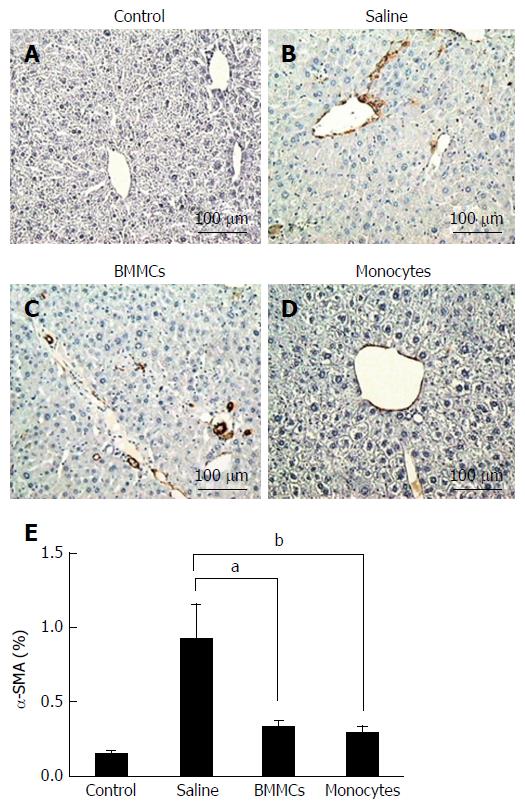
Figure 4 Immunohistochemistry for detection of α-SMA+ hepatic stellate cells in histological sections.
A-D: Control (A), saline-treated (B), BMMCs-treated (C) and CD11b+CD14+ monocyte-treated (D) groups of mice (magnification × 200); E: Measurement of α-SMA+ hepatic stellate cells at 2 mo after treatment with CD11b+CD14+ monocytes and BMMCs. aP < 0.05; bP < 0.01. BMMCs: Bone marrow mononuclear cells.
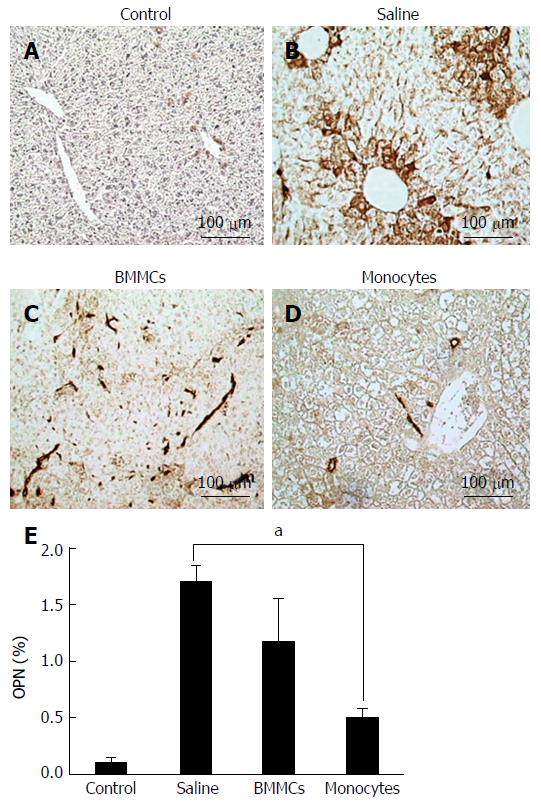
Figure 5 Immunohistochemistry for detection of osteopontin in histological sections.
A-D: Control (A), saline-treated (B), BMMCs-treated (C) and CD11b+CD14+ monocyte-treated (D) groups of mice (magnification × 200); E: Levels of hepatic OPN at 2 mo after treatment with CD11b+CD14+ monocytes. aP < 0.05. OPN: Osteopontin. BMMCs: Bone marrow mononuclear cells.
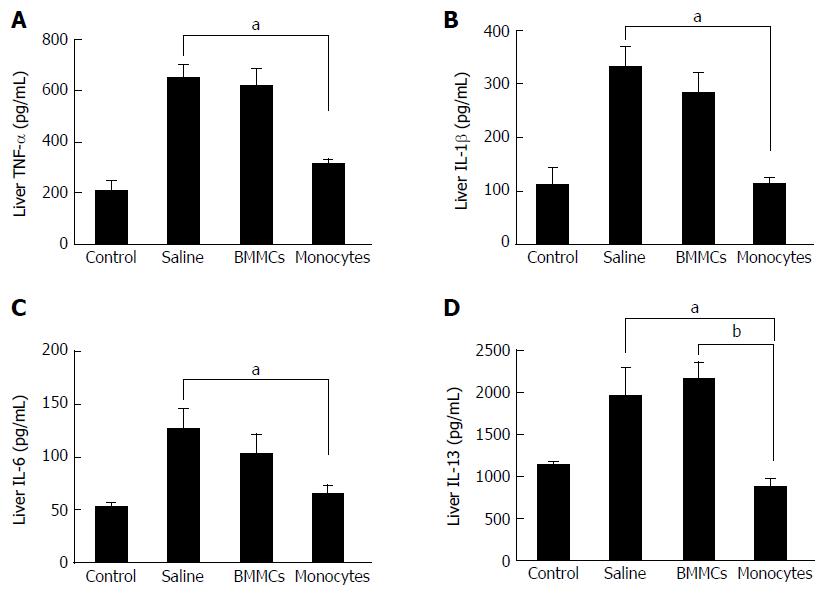
Figure 6 Effects of monocyte therapy on the cytokine profile of tumor necrosis factor-alpha (A), interleukin-1β (B), interleukin-6 (C) and interleukin-13 (D), as measured by enzyme-linked immunosorbent assay.
Data are represented graphically as the mean ± SEM of 5 mice/group. aP < 0.05; bP < 0.01. BMMCs: Bone marrow mononuclear cells; IL: Interleukin; TNF-α: Tumor necrosis factor-alpha.
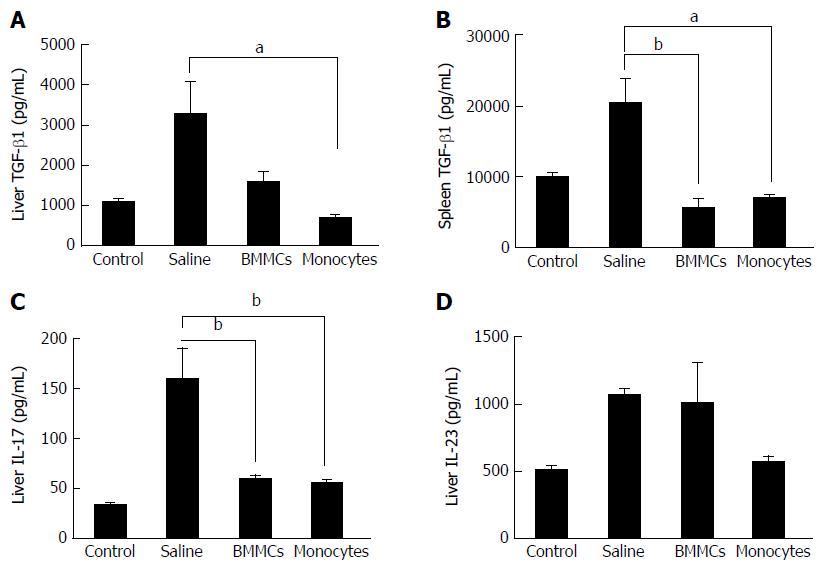
Figure 7 Effects of monocyte-based therapy on chronically liver-damaged mice.
A: Hepatic levels of TGF-β1; B: Splenic levels of TGF-β1; C and D: Hepatic levels of IL-17 (C) and IL-23 (D). aP < 0.05; bP < 0.01. TGF-β: Transforming growth factor-beta; IL: Interleukin; BMMCs: Bone marrow mononuclear cells.
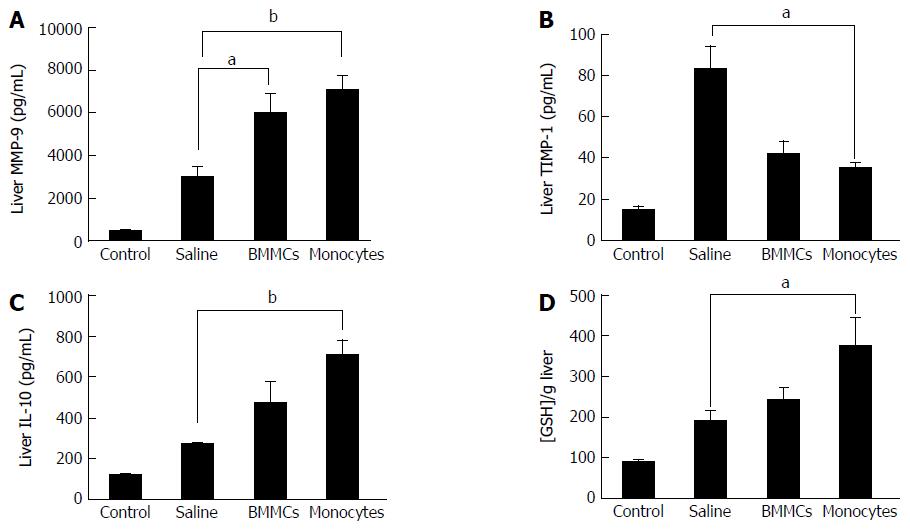
Figure 8 Effects of monocyte-based therapy on hepatic levels of matrix metalloproteinases-9 (A), tissue inhibitors of metalloproteinase-1 (B), interleukin-10 (C) and glutathione (D), in chronically liver-damaged mice.
aP < 0.05; bP < 0.01. MMP-9: Matrix metalloproteinases-9; TIMP: Tissue inhibitors of metalloproteinase; IL: Interleukin; GSH: Glutathione; BMMCs: Bone marrow mononuclear cells.
- Citation: de Souza VCA, Pereira TA, Teixeira VW, Carvalho H, de Castro MCAB, D’assunção CG, de Barros AF, Carvalho CL, de Lorena VMB, Costa VMA, Teixeira ÁAC, Figueiredo RCBQ, de Oliveira SA. Bone marrow-derived monocyte infusion improves hepatic fibrosis by decreasing osteopontin, TGF-β1, IL-13 and oxidative stress. World J Gastroenterol 2017; 23(28): 5146-5157
- URL: https://www.wjgnet.com/1007-9327/full/v23/i28/5146.htm
- DOI: https://dx.doi.org/10.3748/wjg.v23.i28.5146


