Copyright
©The Author(s) 2017.
World J Gastroenterol. Jul 28, 2017; 23(28): 5127-5145
Published online Jul 28, 2017. doi: 10.3748/wjg.v23.i28.5127
Published online Jul 28, 2017. doi: 10.3748/wjg.v23.i28.5127
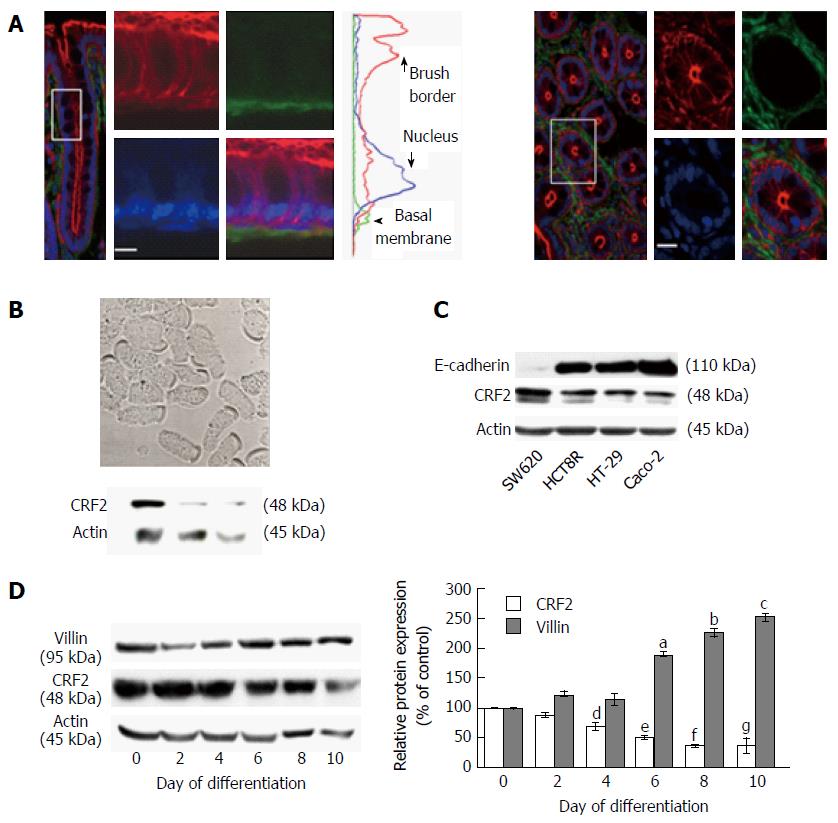
Figure 1 Corticotropin releasing factor receptor 2 expression in colonic epithelial cells.
A: Confocal microscopy analysis of CRF2 protein expression (green) in Sprague-Dawley rat proximal colon. Actin and nuclei are labeled by phaloïdin-TRITC (red) and Topro-3 (blue). Longitudinal profile (left panel) and transversal profile (right panel) showing the crypts. Scale bar, 5 μm. Middle curves represent the means of fluorescence were measured according the basal-apical axis of epithelial cells. Acquisitions were performed on a Leica TCS SPE confocal microscope (objective × 100); B: Upper panel: Phase contrast analysis of dissociated epithelial cells from proximal colon of Sprague-Dawley rats. Scale bar, 5 μm. Lower panel: western blot detection of CRF2 expression in lysates of dissociated epithelial cells from three different animals; C: Detection of E-cadherin and CRF2 protein expression by western blot in various human colon carcinoma cell lines. Actin served as a loading control; D: Left panel: Detection of CRF2 and villin protein expression by western blot according to the kinetic of HT-29 cell differentiation. Actin served as a loading control. Right panel: Quantification of CRF2 and villin protein levels from western blot analysis. Data were expressed as fold increase of CRF2 or villin/actin protein levels of differentiated (D2, D4, D6, D8 and D10) vs undifferentiated cells (D0). Data represents means of three different experiments ± SEM, a,b,c,e,fP < 0.001 vs undifferentiated HT-29 cells (D0), d,gP < 0.01 vs D0. CRF2: Corticotropin releasing factor receptor 2.
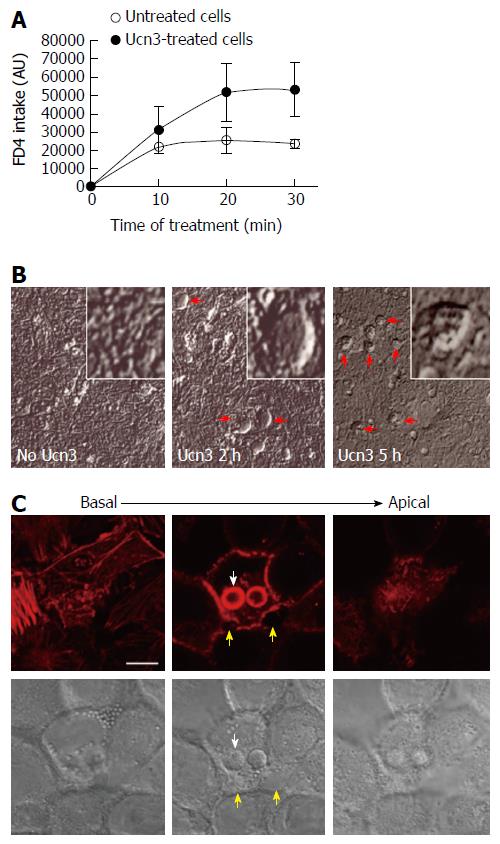
Figure 2 Corticotropin releasing factor receptor 2 signaling increases trans-epithelial permeability in early-differentiated HT-29 cells.
A: The trans-cellular flux of dextran-FITC (4 kDa) was measured by spectrofluorimetry. HT-29 cells were cultured during 10 d in Gal medium. After 5 h treatment or not (untreated cells) with 100 nmol/L Ucn3, dextran-FITC was added at the apical compartment. Then the green fluorescence incorporated in the cell monolayer was measured after 10, 20, and 30 min. The release of fluorescence in the basal compartment is associated to trans-cellular permeability. Ucn3 treatment seems to increase transcellular transport in early-differentiated HT-29 cells. Two-way ANOVA, P < 0.01; B: Phase contrast analysis of early differentiated HT-29 cells exposed or not to Ucn3 (100 nmol/L). (Scale bar: 25 μm). Red arrows indicate the formation of refractile structures inside the epithelial monolayer; C: Confocal imaging from basal to apical poles of phaloidin-TRITC labeling (upper panel) and Differential Interference Contrast (lower panel) of early-differentiated HT-29 cells treated 2 h with 100 nmol/L Ucn3 (Scale bar: 10 μm). White arrows indicate refractile structures as observed before by phase contrast microscopy, while yellow arrows show alterations in cell-cell contacts. Acquisitions were performed on a Leica TCS SPE confocal microscope (objective × 100).
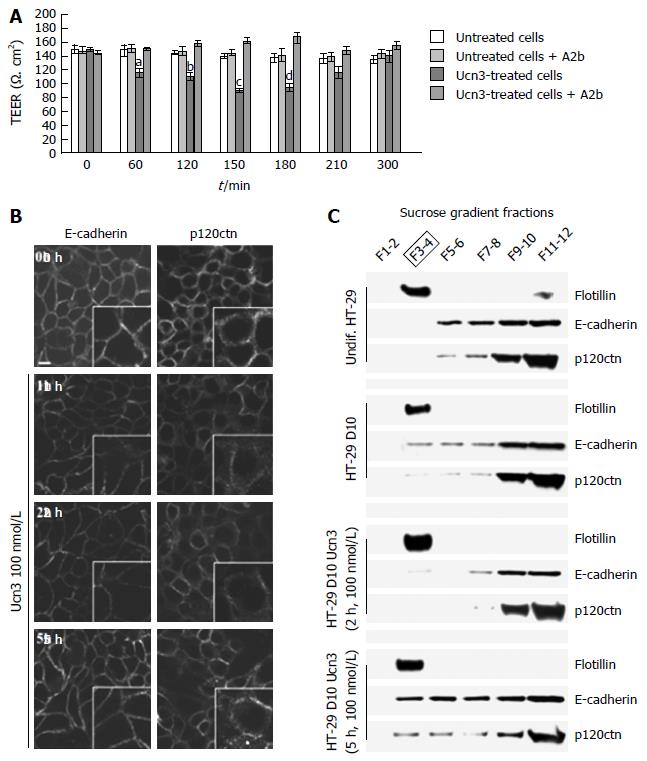
Figure 3 Corticotropin releasing factor receptor 2 signaling alters intercellular junction organization and increases para-cellular permeability in early-differentiated HT-29 cells.
A: Early-differentiated HT-29 cells were pre-incubated with or without A2b (1 μmol/L) overnight before addition or not of Ucn3 (100 nmol/L). Intercellular junction integrity was evaluated by measuring transepithelial electrical resistance (TEER). Values are means of 5 different experiments ± SEM. a,dP < 0.05 vs the three other groups, bP < 0.01 vs the three other groups and cP < 0.001 vs the three other groups; B: Early differentiated HT-29 cells were treated or not with 100 nmol/L Ucn3 before immunostaining for E-cadherin (left panels) and p120ctn (right panels). Bar is 5 μm. Images were acquired by confocal microscopy on a LEICA TCS/SPE (objective × 100). Ucn3 treatment induces a time-dependent alteration of AJ protein localization; C: AJ proteins are associated with Flotillin-1 enriched LR during HT-29 cell differentiation. Lysates from undifferentiated or early-differentiated HT-29 cells (10 d, D10) exposed or not to 100 nmol/L Ucn3 were fractionated using a sucrose gradient. The presence of LR was assessed by western blot against Flotillin-1. Western blot analysis of Flotillin-1, E-cadherin and p120ctn protein levels in LR under previously described conditions.
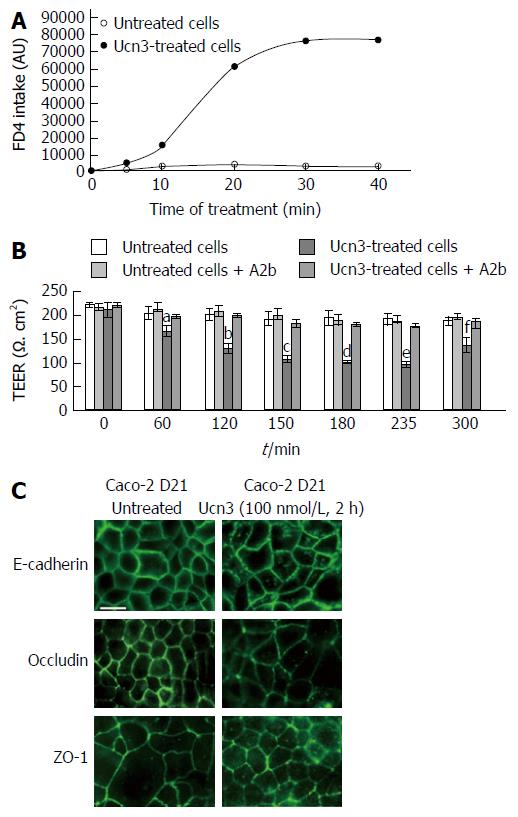
Figure 4 Corticotropin releasing factor receptor 2 signaling increases para-cellular permeability and alteration of adherens junctions and tight junctions in spontaneously differentiated Caco-2 cells.
A: The trans-cellular flux of dextran-FITC (4 kDa) was measured by spectrofluorimetry. Caco-2 cells were cultured 21 d after they reached confluence. After 5 h treatment or not (untreated cells) with 100 nmol/L Ucn3, dextran-FITC was added at the apical compartment. Then the green fluorescence incorporated in the cell monolayer was measured after 5, 10, 20, 30 and 40 min. The release of fluorescence in the basal compartment is associated to trans-cellular permeability. Ucn3 treatment seems to increase transcellular transport in well-differentiated Caco-2 cells. Two-way ANOVA, P < 0.001. B: Twenty-one days differentiated Caco-2 cells were pre-incubated with or without A2b (1 μmol/L) overnight before addition or not of Ucn3 (100 nmol/L). Intercellular junction integrity was evaluated by measuring transepithelial electrical resistance (TEER). Values are means of 5 different experiments ± SEM. aP < 0.05 vs the three other groups, fP < 0.01 vs the three other groups and b,c,d,eP < 0.001 vs the three other groups; C: Twenty-one days differentiated Caco-2 cells were treated or not with 100 nmol/L Ucn3 before immunostaining for E-cadherin (upper panels), occludin (middle panels) and ZO-1 (lower panels). Bar is 20 μm. Images were acquired by confocal microscopy on a LEICA TCS/SPE (objective × 100). Ucn3 treatment induces a time-dependent alteration of AJ and TJ protein localization.
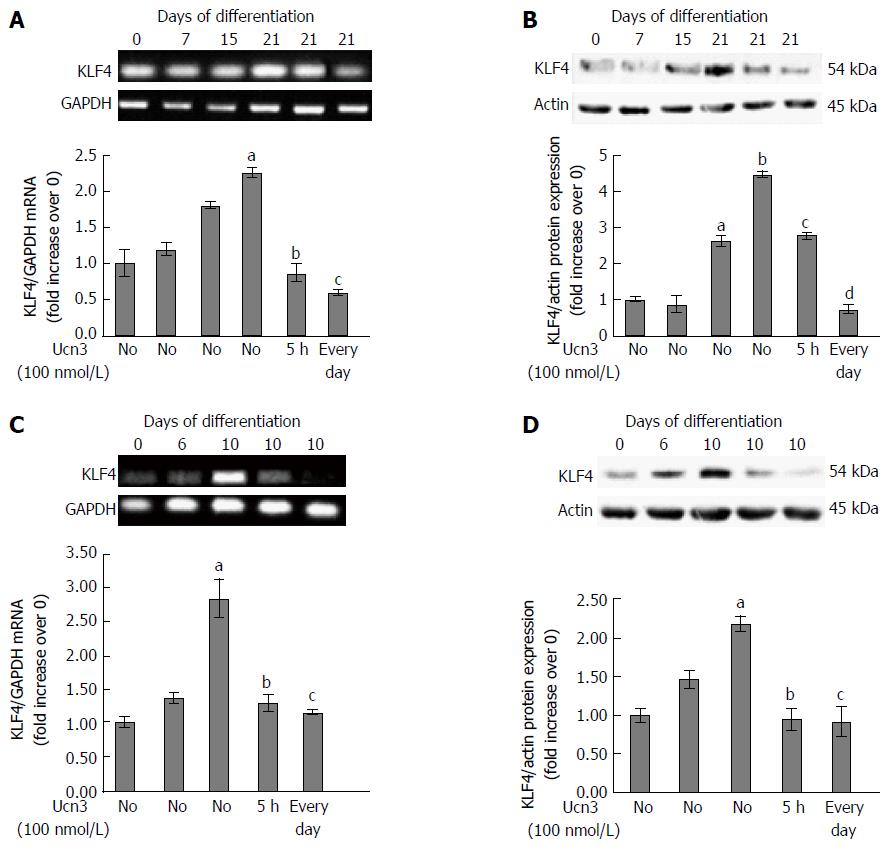
Figure 5 Down-regulation of KLF4 mRNA and protein expression following corticotropin releasing factor receptor 2 signaling.
A: Detection of KLF4 mRNA expression by RT-PCR during the kinetic of Caco-2 cell differentiation and after acute (5 h) or chronic (every day) exposure to 100 nmol/L Ucn3 of 21 d differentiated cells. GAPDH served as a housekeeping control. Quantification of KLF4 mRNA from RT-PCR assays (lower panel). Data were expressed as fold increase of KLF4/GAPDH mRNA levels of differentiated (D7, D15, D21) vs undifferentiated cells (D0). Data represents means of three different experiments ± SEM. a,bP < 0.001 vs undifferentiated Caco-2 cells (D0); cP < 0.001 vs differentiated Caco-2 cells (D21). B: Detection of KLF4 protein expression by western blot during the kinetic of Caco-2 cell differentiation and after acute (5 h) or chronic (every day) exposure to 100 nmol/L Ucn3 of 21 d differentiated cells. Actin served as a loading control. Lower panel: Quantification of KLF4 protein levels from western blot analyses. Data were expressed as fold increase of KLF4/actin protein levels of differentiated (D7, D15, D21) vs undifferentiated cells (D0). Data represents means of three different experiments ± SEM. a,bP < 0.001 vs undifferentiated Caco-2 cells (D0); c,dP < 0.001 vs differentiated Caco-2 cells (D21). C: Detection of KLF4 mRNA expression by RT-PCR during the kinetic of HT-29 cell differentiation and after acute (5 h) or chronic (every day) exposure to 100 nmol/L Ucn3 of 10 d differentiated cells. GAPDH served as a housekeeping control. Quantification of KLF4 mRNA from RT-PCR assays (lower panel). Data were expressed as fold increase of KLF4/GAPDH mRNA levels of differentiated (D6 and D10) vs undifferentiated cells (D0). Data represents means of three different experiments ± SEM. Data represents means of three different experiments ± SEM. aP < 0.001 vs undifferentiated HT-29 cells (D0); bP < 0.05 vs early differentiated HT-29 cells (D10), cP < 0.01 vs D10. D: Detection of KLF4 protein expression by western blot during the kinetic of HT-29 cell differentiation and after acute (5 h) or chronic (every day) exposure to 100 nmol/L Ucn3 of 10 d differentiated cells. Actin served as a loading control. Lower panel: Quantification of KLF4 protein levels from western blot analyses. Data were expressed as fold increase of KLF4/actin protein levels of differentiated (D6 and D10) vs undifferentiated cells (D0). Data represents means of three different experiments ± SEM. aP < 0.001 vs undifferentiated HT-29 cells (D0); b,cP < 0.001 vs early differentiated HT-29 cells (D10).
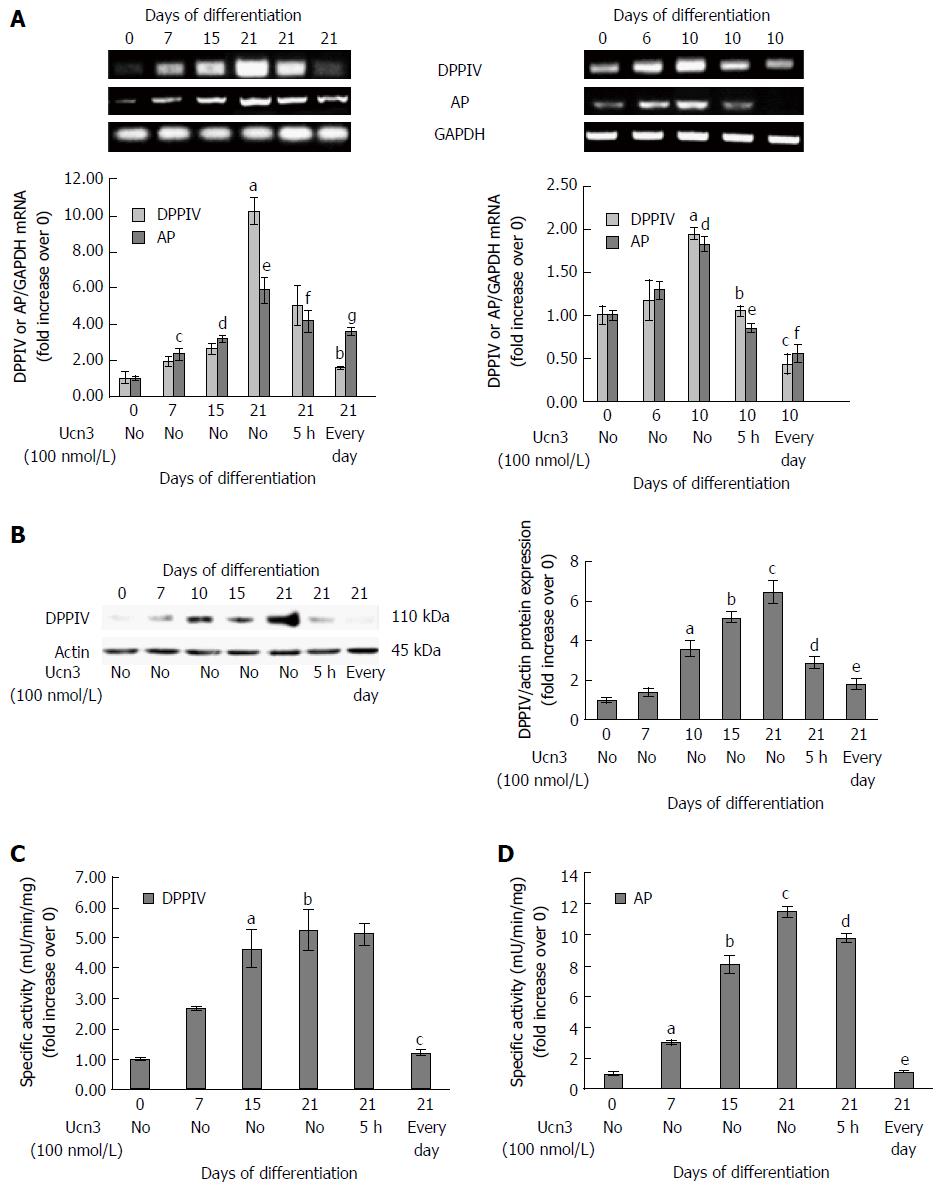
Figure 6 Corticotropin releasing factor receptor 2 signaling alters expression of characteristic markers of enterocyte differentiation.
A: Right panel: Detection of DPPIV and AP mRNA expression by RT-PCR during the kinetic of Caco-2 cell differentiation and after acute (5 h) or chronic (every day) exposure to 100 nmol/L Ucn3 of 21 d differentiated cells. GAPDH served as a housekeeping control. Quantification of KLF4 and AP mRNA from RT-PCR assays (lower panel). Data were expressed as fold increase of KLF4 or AP/GAPDH mRNA levels of differentiated (D7, D15, D21) vs undifferentiated cells (D0). Data represents means of three different experiments ± SEM. a,cP < 0.01 vs undifferentiated Caco-2 cells (D0), d,eP < 0.001 vs D0, bP < 0.05 vs differentiated Caco-2 cells (D21), fP < 0.01 vs D21, gP < 0.001 vs D21; Note that normality of distribution was not respected for DPPIV PCR. Left panel: Detection of DPPIV and AP mRNA expression by RT-PCR during the kinetic of HT-29 cell differentiation and after acute (5 h) or chronic (every day) exposure to 100 nmol/L Ucn3 of 10 d differentiated cells. GAPDH served as a housekeeping control. Quantification of DPPIV and AP mRNA from RT-PCR assays (lower panel). Data were expressed as fold increase of DPPIV and AP/GAPDH mRNA levels of differentiated (D6 and D10) vs undifferentiated cells (D0). Data represents means of three different experiments ± SEM. Data represents means of three different experiments ± SEM. a,dP < 0.01 vs undifferentiated HT-29 cells (D0); bP < 0.01 vs early differentiated HT-29 cells (D10), c,e,fP < 0.001 vs D10; B: Left panel: Detection of DPPIV protein expression by western blot during the kinetic of Caco-2 cell differentiation and after acute (5 h) or chronic (every day) exposure to 100 nmol/L Ucn3 of 21 d differentiated cells. Actin served as a loading control. Right panel: Quantification of DPPIV protein levels from western blot analysis. Data were expressed as fold increase of DPPIV/actin protein levels of differentiated (D7, D15, D21) vs undifferentiated cells (D0). Data represents means of three different experiments ± SEM. aP < 0.01 vs undifferentiated Caco-2 cells (D0), b,cP < 0.001 vs D0, dP < 0.01 vs differentiated Caco-2 cells (D21), eP < 0.001 vs D21. C and D: Detection of DPPIV (C) and AP (D) enzymatic activities during the kinetic of Caco-2 cell differentiation and after acute (5 h) or chronic (every day) exposure to 100 nmol/L Ucn3 of 21 d differentiated cells. Data were expressed as fold increase of enzymatic activities of differentiated (D7, D15, D21) vs undifferentiated cells (D0). Data represents means of three different experiments ± SEM. For C: a,bP < 0.001 vs undifferentiated Caco-2 cells (D0); cP < 0.01 vs differentiated Caco-2 cells (D21). For D: aP < 0.05 vs undifferentiated Caco-2 cells (D0), b,cP < 0.001 vs D0, dP < 0.05 vs differentiated Caco-2 cells (D21) and eP < 0.001 vs D21.
- Citation: Ducarouge B, Pelissier-Rota M, Powell R, Buisson A, Bonaz B, Jacquier-Sarlin M. Involvement of CRF2 signaling in enterocyte differentiation. World J Gastroenterol 2017; 23(28): 5127-5145
- URL: https://www.wjgnet.com/1007-9327/full/v23/i28/5127.htm
- DOI: https://dx.doi.org/10.3748/wjg.v23.i28.5127


