Copyright
©The Author(s) 2017.
World J Gastroenterol. Jul 28, 2017; 23(28): 5115-5126
Published online Jul 28, 2017. doi: 10.3748/wjg.v23.i28.5115
Published online Jul 28, 2017. doi: 10.3748/wjg.v23.i28.5115
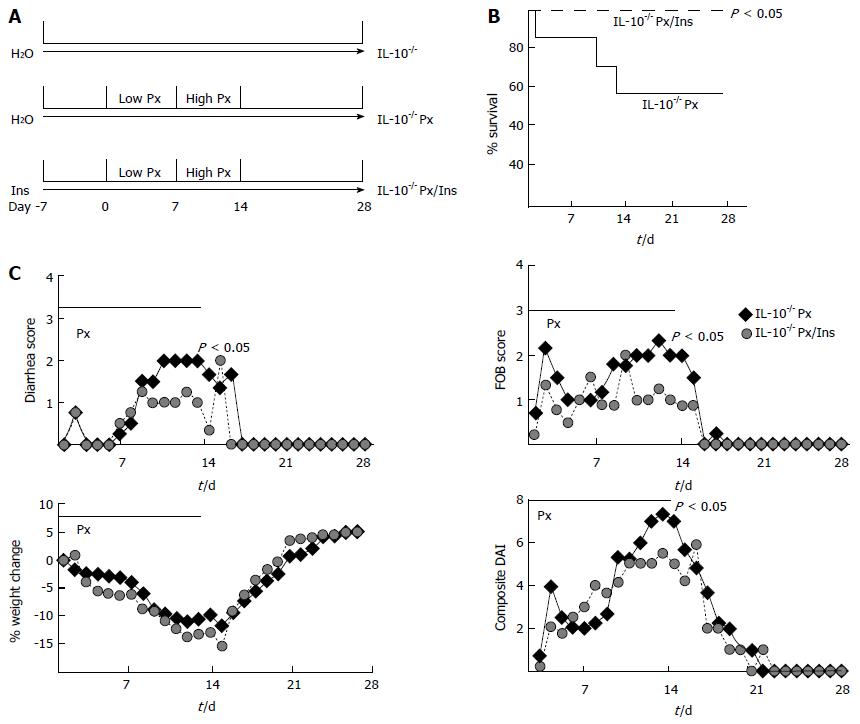
Figure 1 Myo-inositol reduces mortality and disease activity indices in IL-10-/- Px mice.
A: Schematic diagram of Px and myo-inositol treatment in IL-10-/- mice; B: A Kaplan-Meier survival curve shows decreased mortality in IL-10-/- Px/myo-inositol mice; C: Disease activity indices (DAIs) for IL-10-/- Px and IL-10-/- Px/Ins mice. For diarrhea and fecal occult blood (FOB), scores are based on a scale from 0-4, with 0 being normal and 4 being the most severe (Methods). Percent weight change was calculated as weight change relative to the baseline weight at day 1. The composite DAI includes diarrhea and FOB scores, as well as weight change. The bar denotes Px treatment. Data points represent the mean, n = 4 mice in each group. P < 0.05 on day 14.
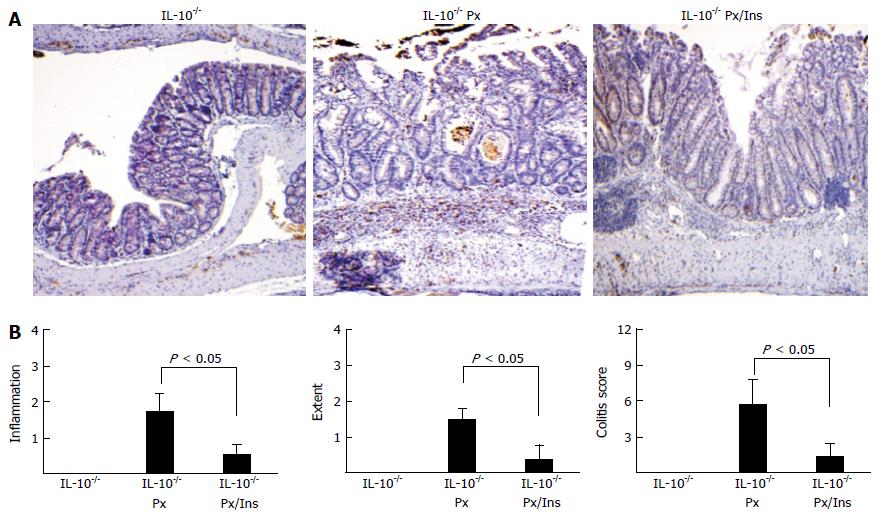
Figure 2 Myo-inositol reduces inflammation in IL-10-/- Px mice.
A: Representative MPO staining of the proximal-distal junction in IL-10-/- control, IL-10-/- Px and IL-10-/- Px/myo-inositol colon at day 28; B: Histological grading of colitis shows that myo-inositol reduces the severity of inflammation, the extent (thickness) of inflammation, and the combined colitis score. Untreated IL-10-/- mice did not exhibit inflammation at day 28. Values represent the mean ± SE, n = 4 mice in each group.
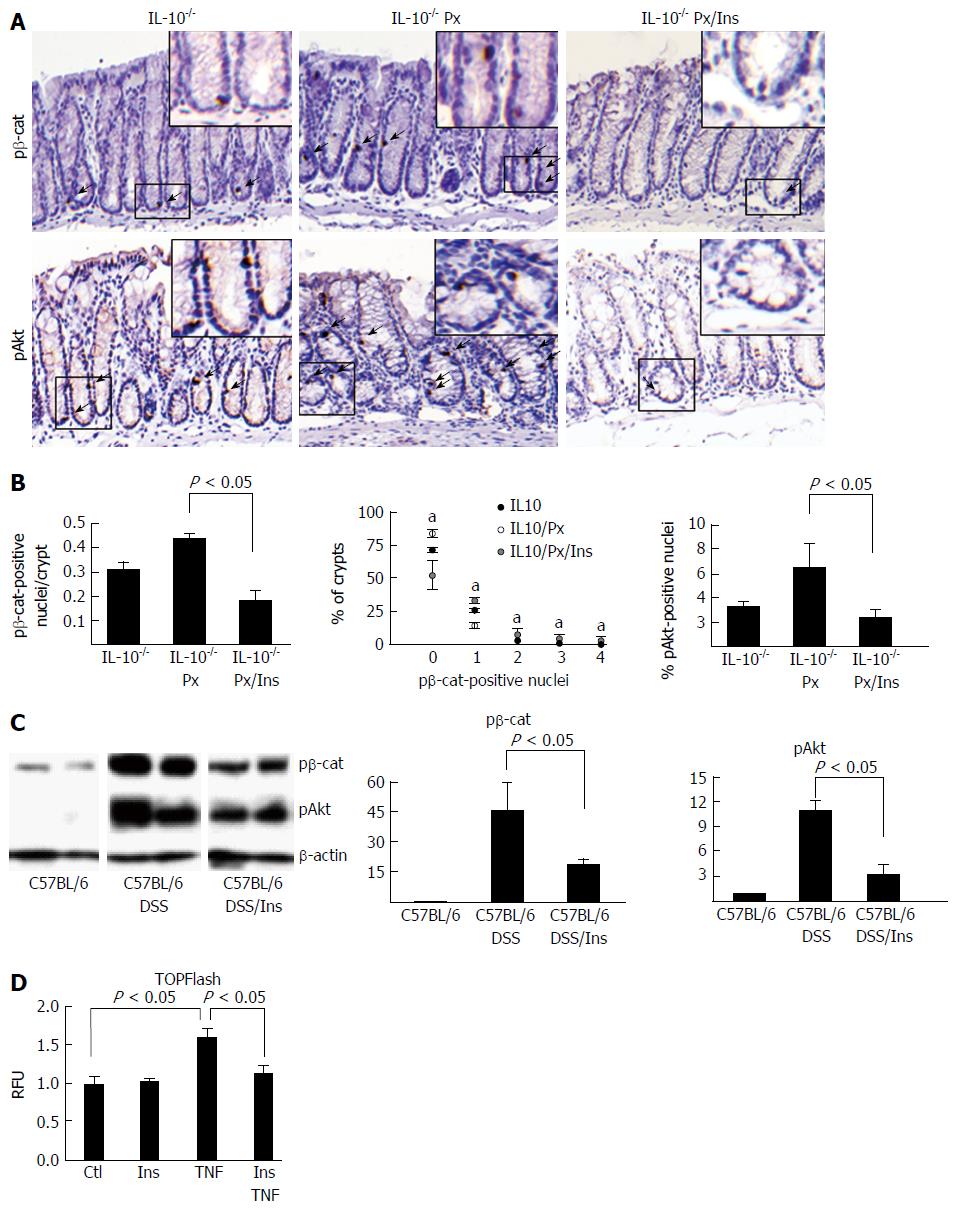
Figure 3 pβ-cat and pAkt are reduced in colitis mice treated with myo-inositol.
A: Representative images of pβ-cat and pAkt staining; B: Quantification of the number of pβ-cat- and pAkt-positive nuclei. Distribution of the percent of crypts containing 0-5 pβ-cat-positive nuclei. Values represent the mean ± SE, n = 4 mice in each group. aP < 0.05; C: Western blots of IEC showing levels of nuclear pβ-cat and pAkt in the 8 cycle model of DSS-induced colitis. Lanes were rearranged to be consistent with formatting. Densitometry was normalized to β-actin and presented as the fold change (mean ± SE). n = 2 control mice, 3 DSS-treated mice, and 3 DSS/myo-inositol-treated mice; D: TOPFlash reporter assay (shown in relative fluorescence units, RFU) for β-catenin activation in NCM460 cells treated with TNF or myo-inositol. n = 4 separate experiments.
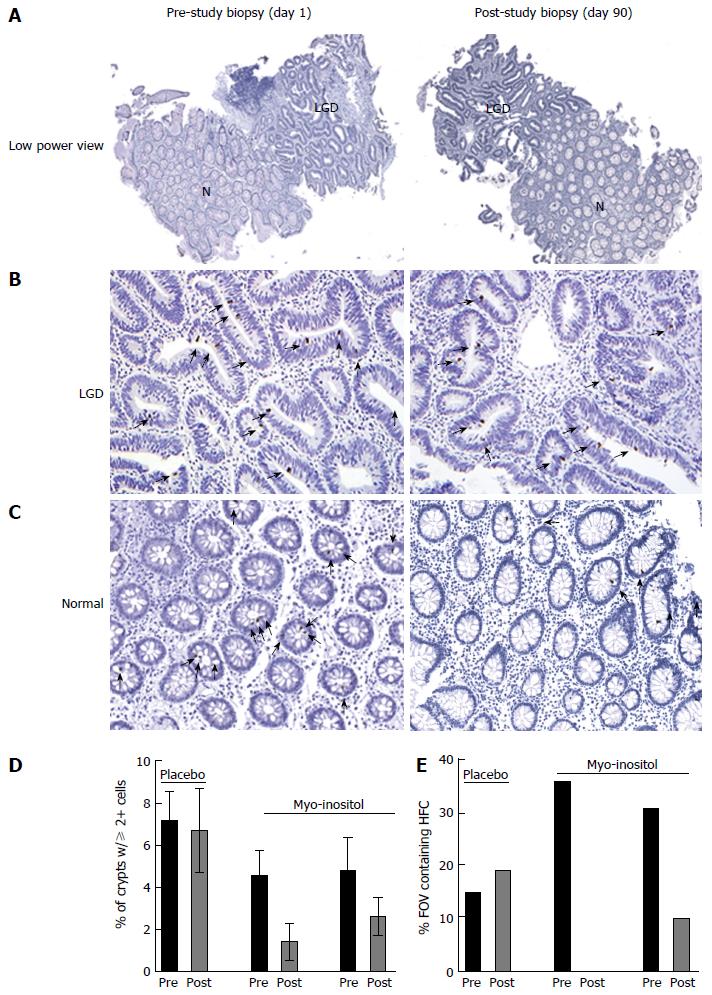
Figure 4 Myo-inositol reduces the number of pβ-cat-positive cells in ulcerative colitis patients.
A: Representative low power images of biopsies stained for pβ-cat from a patient before and after 90 d of myo-inositol treatment. B: pβ-cat staining in an area of LGD; C: pβ-cat staining in a non-dysplastic area adjacent to LGD. Note the HFC containing multiple pβ-cat-positive nuclei; D: Graphic representation of the percent of crypts from each patient pre- and post-treatment containing 2 or more pβ-cat-positive nuclei; E: The percent of all high powered fields of view (FOV) containing HFC in biopsies from each patient. N: Normal tissue; LGD: Low grade dysplasia.
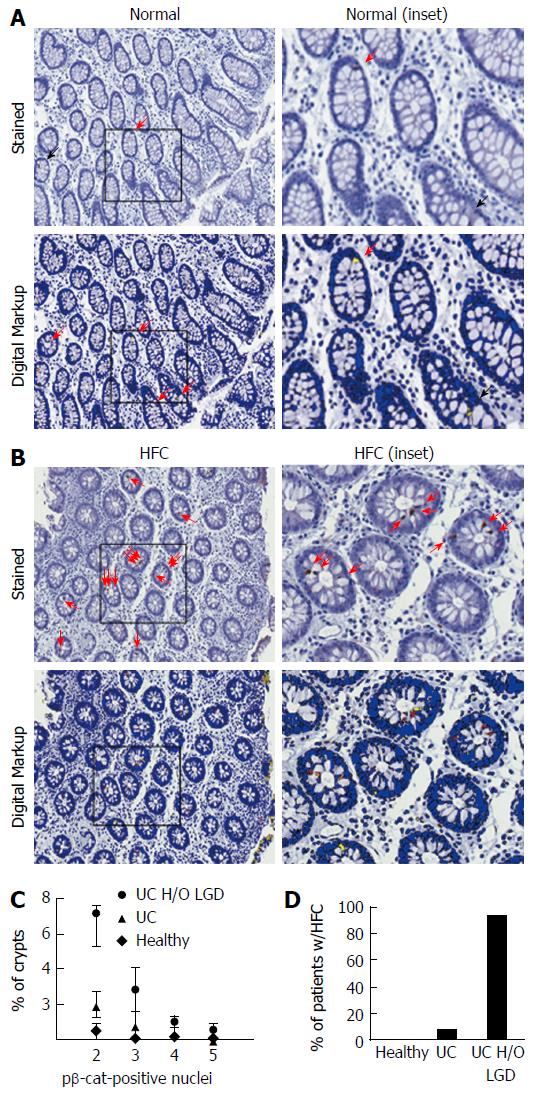
Figure 5 Crypts with elevated pβ-cat staining identify ulcerative colitis patients at a high risk for low grade dysplasia.
A: Representative images of pβ-cat staining and the digital markup in colon biopsies of UC patients with normal pβ-cat distribution (benign disease); and B: HFC. Red arrows indicated pβ-cat-positive nuclei identified by eye; black arrows indicate false positive or negative nuclei properly identified by digital analysis; C: Statistical distribution of pβ-cat-positive nuclei in normal biopsies showing that crypts with 2 more positive pβ-cat-positive nuclei are rarely detected in healthy patients (diamonds, n = 3) or patients with benign, active UC (triangles, n = 12) but are more frequent in UC patients with a previous history of LGD (circles, n = 16). Data are shown as the percent of crypt cross-sections containing pβ-cat-positive nuclei; D: Biopsies from healthy controls, benign UC, and UC patients with a history of LGD were analyzed for the presence of HFC. UC: Ulcerative colitis; LGD: Low grade dysplasia; HFC: High frequency crypts.
- Citation: Bradford EM, Thompson CA, Goretsky T, Yang GY, Rodriguez LM, Li L, Barrett TA. Myo-inositol reduces β-catenin activation in colitis. World J Gastroenterol 2017; 23(28): 5115-5126
- URL: https://www.wjgnet.com/1007-9327/full/v23/i28/5115.htm
- DOI: https://dx.doi.org/10.3748/wjg.v23.i28.5115


