Copyright
©The Author(s) 2017.
World J Gastroenterol. Jul 21, 2017; 23(27): 5004-5017
Published online Jul 21, 2017. doi: 10.3748/wjg.v23.i27.5004
Published online Jul 21, 2017. doi: 10.3748/wjg.v23.i27.5004
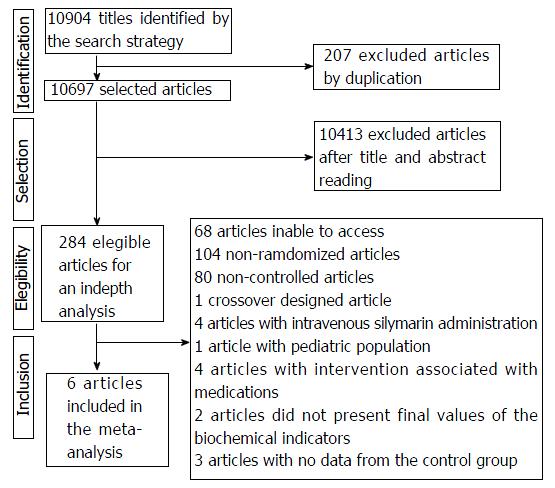
Figure 1 Flow of selection of articles included in the meta-analysis.
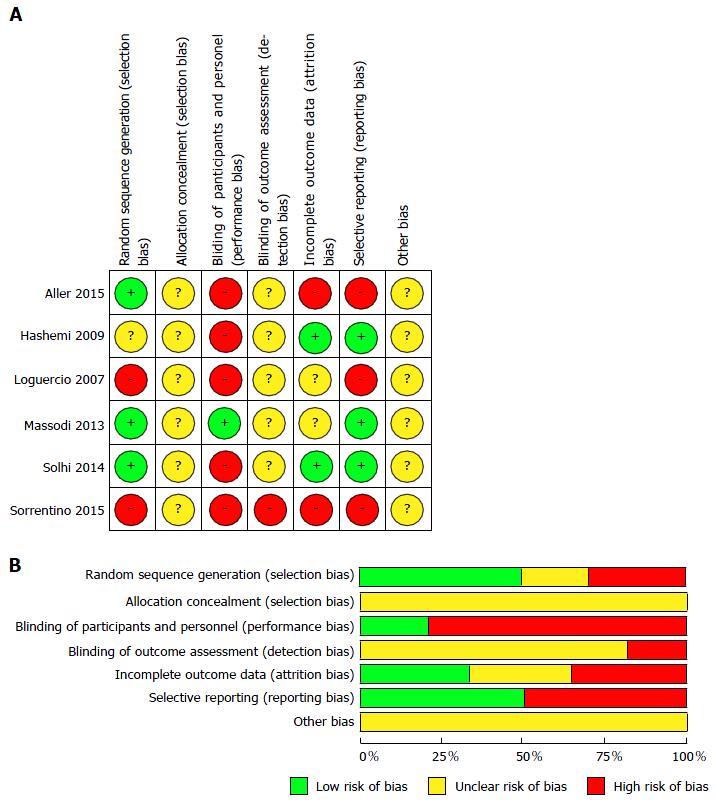
Figure 2 Risk of bias assessment.
A: Risk of bias summary: review authors’ judgments about each risk of bias item for each included study; B: Risk of bias graph: review authors’ judgments about each risk of bias item presented as percentages across all included studies.
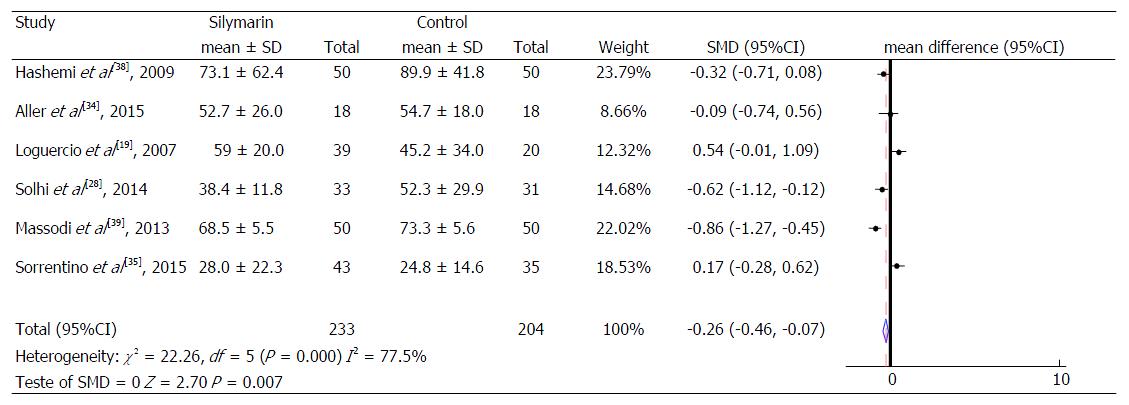
Figure 3 Alanine aminotransferase levels.
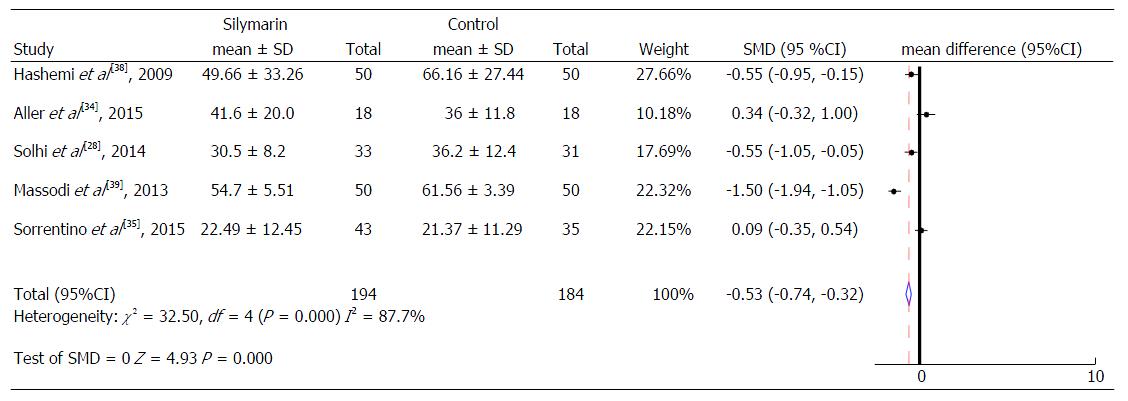
Figure 4 Aspartate aminotransferase levels.
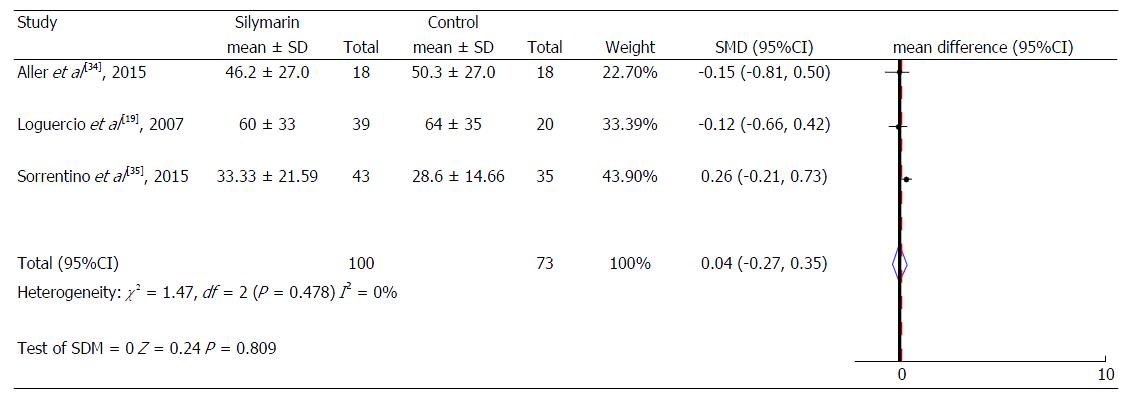
Figure 5 Gamma glutamyl transpeptidase levels.
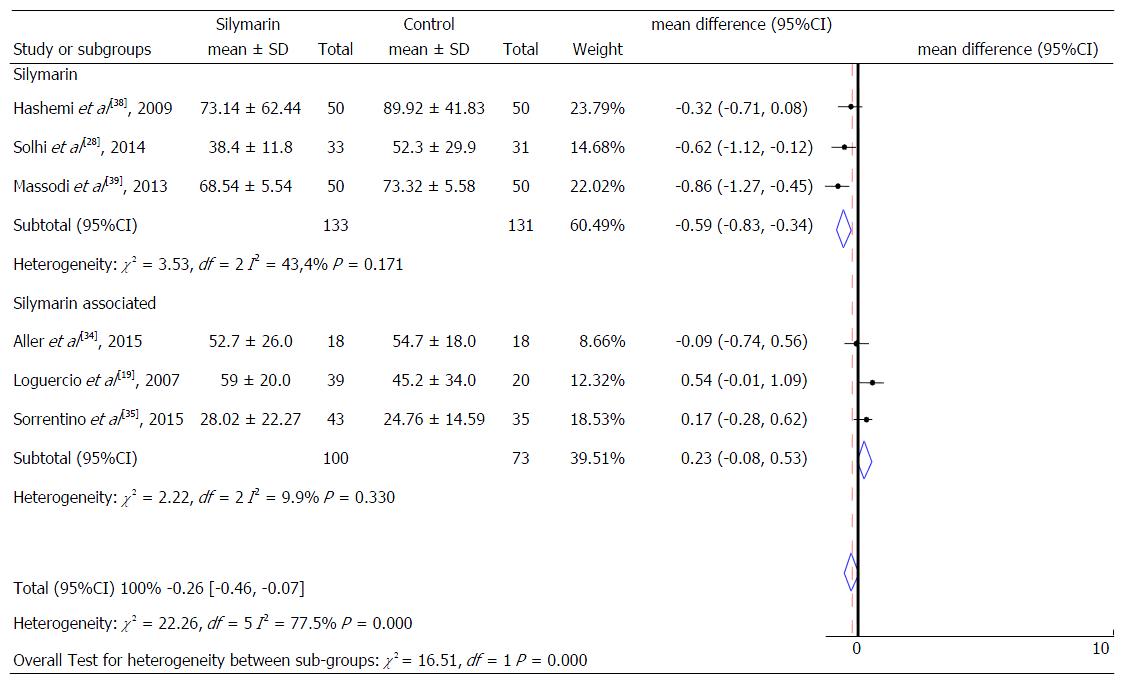
Figure 6 Alanine aminotransferase levels according to the type of product used.
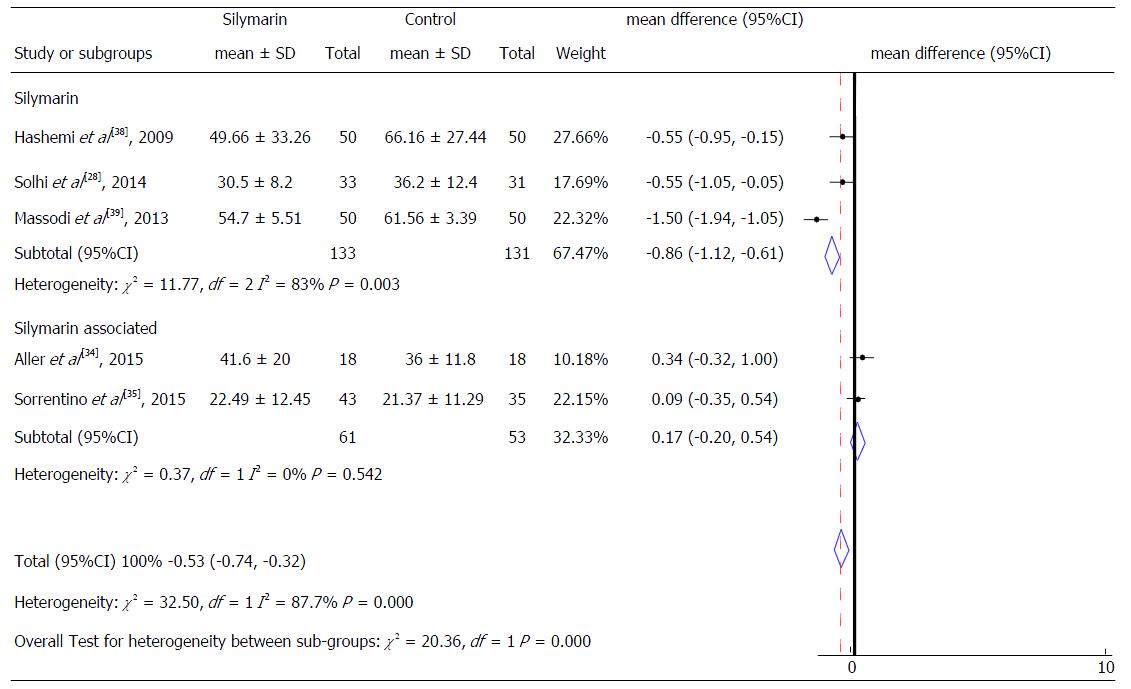
Figure 7 Aspartate aminotransferase levels according to the type of product used.
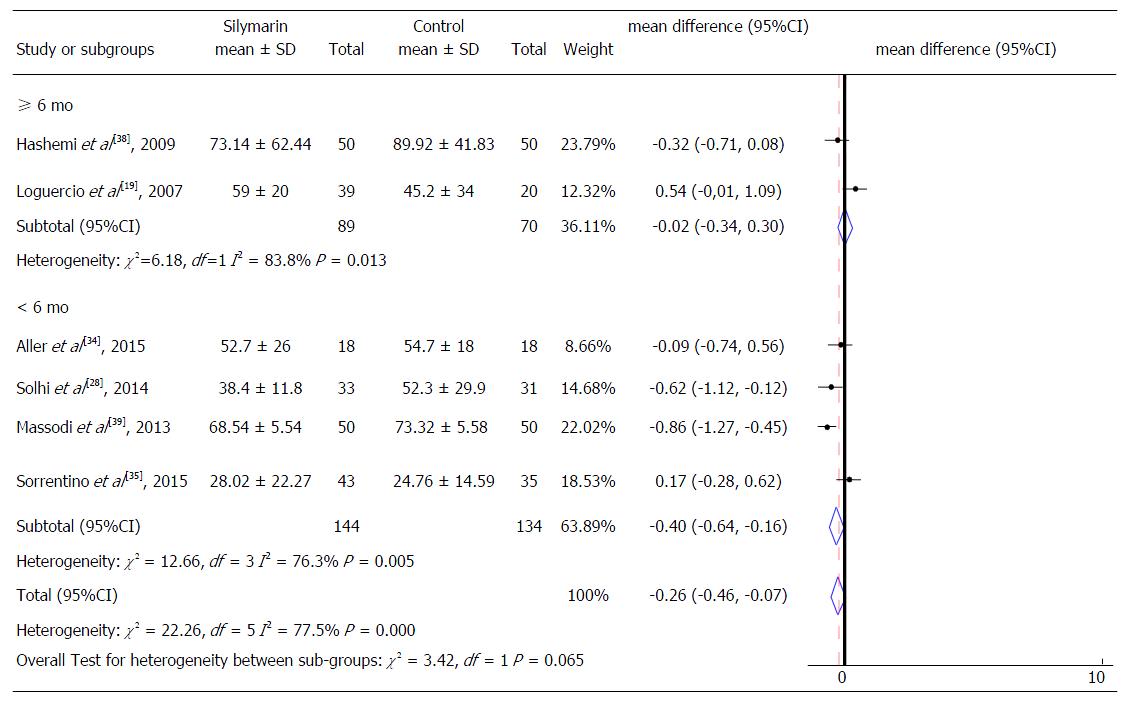
Figure 8 Alanine aminotransferase levels according to intervention time.
- Citation: de Avelar CR, Pereira EM, de Farias Costa PR, de Jesus RP, de Oliveira LPM. Effect of silymarin on biochemical indicators in patients with liver disease: Systematic review with meta-analysis. World J Gastroenterol 2017; 23(27): 5004-5017
- URL: https://www.wjgnet.com/1007-9327/full/v23/i27/5004.htm
- DOI: https://dx.doi.org/10.3748/wjg.v23.i27.5004


