Copyright
©The Author(s) 2017.
World J Gastroenterol. Jul 14, 2017; 23(26): 4839-4846
Published online Jul 14, 2017. doi: 10.3748/wjg.v23.i26.4839
Published online Jul 14, 2017. doi: 10.3748/wjg.v23.i26.4839
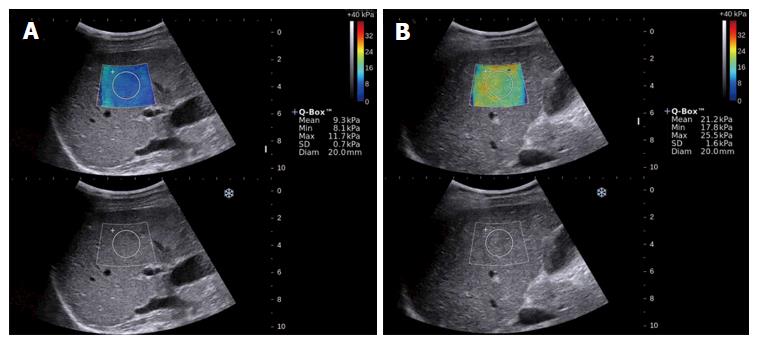
Figure 1 Two-dimensional shear wave elastography measurements in the liver.
A: Fibrosis stage F1; B: Fibrosis stage F4.
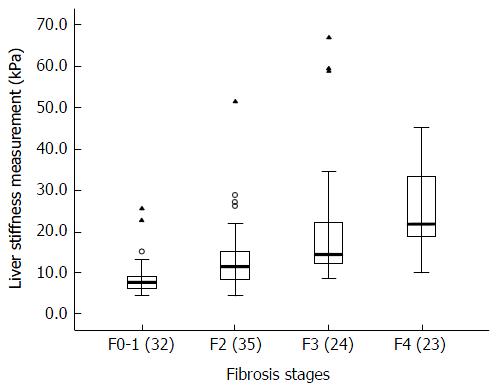
Figure 2 Liver stiffness measurements obtained using two-dimensional shear wave elastography in patients with autoimmune liver diseases.
The box plots show the interquartile ranges m (boxes), medians (thick lines), ranges (thin lines), outside values (circles), and outliers (triangles).
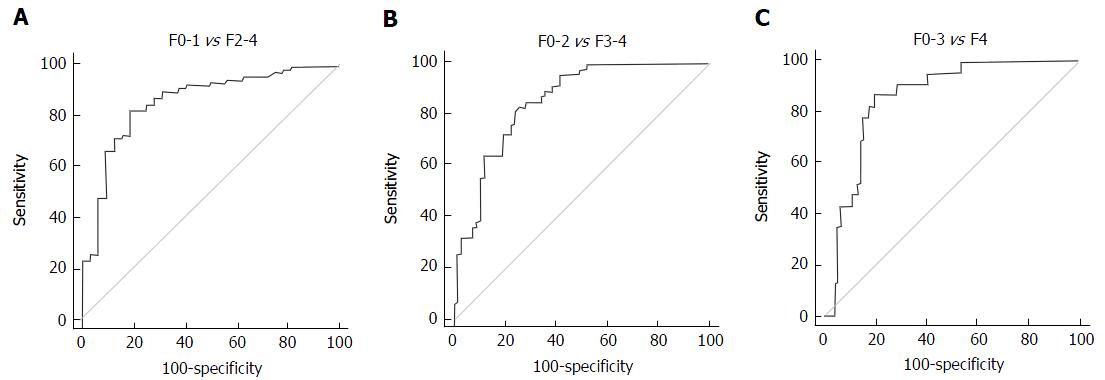
Figure 3 Area under the receiver operating characteristic curves for two-dimensional shear wave elastography in assessing liver fibrosis in patients with autoimmune liver diseases.
A: Significant fibrosis (≥ F2); B: Severe fibrosis (≥ F3); C: Cirrhosis (F4).
- Citation: Zeng J, Huang ZP, Zheng J, Wu T, Zheng RQ. Non-invasive assessment of liver fibrosis using two-dimensional shear wave elastography in patients with autoimmune liver diseases. World J Gastroenterol 2017; 23(26): 4839-4846
- URL: https://www.wjgnet.com/1007-9327/full/v23/i26/4839.htm
- DOI: https://dx.doi.org/10.3748/wjg.v23.i26.4839


