Copyright
©The Author(s) 2017.
World J Gastroenterol. Jul 14, 2017; 23(26): 4701-4711
Published online Jul 14, 2017. doi: 10.3748/wjg.v23.i26.4701
Published online Jul 14, 2017. doi: 10.3748/wjg.v23.i26.4701
Figure 1 PCR analysis of mouse genotype and fibrinogen levels in plasma and intestinal tissue of Fib+/+, Fib+/- and Fib-/- mice.
A: Representative agarose gel image showing DNA marker (Lane 1), single band at around 376 base pair (Lane 2 and 3) that denotes Fib+/+ mice, double bands, one at around 376 bp and the other is at around 283 bp (Lane 4 and 5), which signify Fib+/- mice, and single band at around 283 bp (Lane 6 and 7) that represents Fib-/- mice; B: Plasma fibrinogen level in un-irradiated Fib+/+ (n = 5), Fib+/- (n = 6) and Fib-/- (n = 5) mice as detected by enzyme-linked immunosorbent assay (ELISA) assay; C: Fibrinogen level in the intestinal tissue of un-irradiated Fib+/+ (n = 6), Fib+/- (n = 10) and Fib-/- (n = 3) mice as detected by ELISA assay.
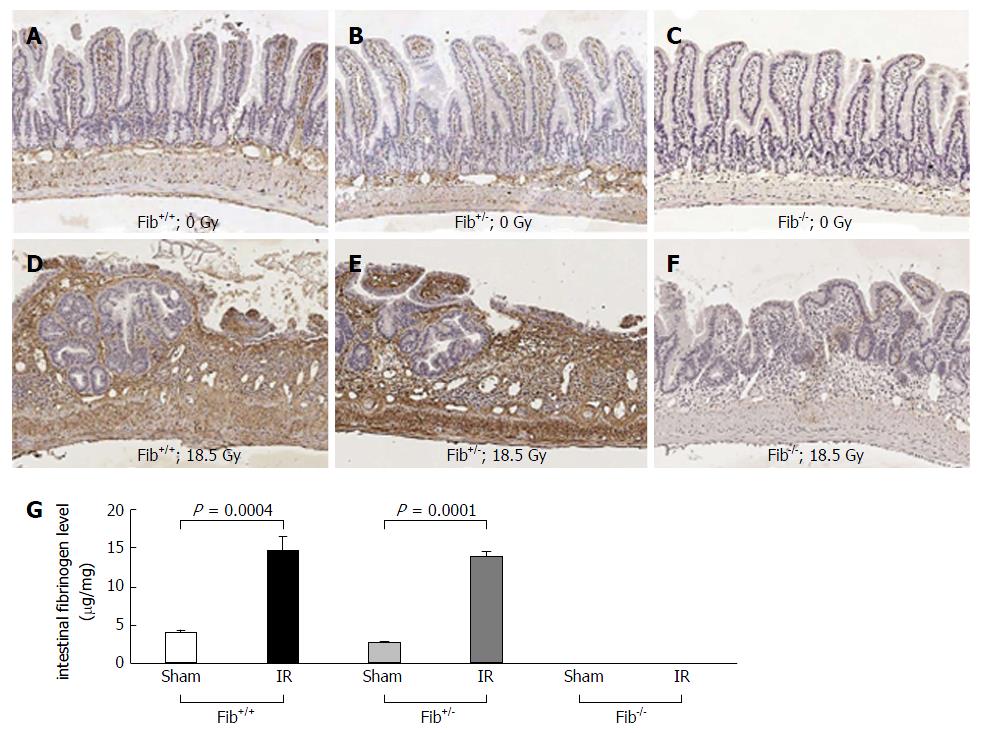
Figure 2 Fibrinogen immunoreactivity in the intestinal tissue of Fib+/+, Fib+/- and Fib-/- mice before and after irradiation.
A: Representative photomicrograph showing fibrinogen level in un-irradiated Fib+/+ mice; B: Fibrinogen level in un-irradiated Fib+/- mice; C: Fibrinogen level in un-irradiated Fib-/- mice; D: Fibrinogen level in irradiated Fib+/+ mice; E: Fibrinogen level in irradiated Fib+/- mice; F: Fibrinogen level in irradiated Fib-/- mice; and G: Column diagram showing comparison of intestinal fibrinogen levels among un-irradiated (n = 6) and irradiated (n = 6) Fib+/+ mice, un-irradiated (n = 10) and irradiated (n = 10) Fib+/- mice, and un-irradiated (n = 3) and irradiated (n = 3) Fib-/- mice.
Figure 3 Morphological changes in the intestinal tissue of Fib+/- and Fib-/- mice observed at 2 wk and 26 wk after localized irradiation.
A: Comparative assessment of structural radiation injury between Fib+/- (n = 15) and Fib-/- (n = 14) mice at 2 wk and Fib+/- (n = 28) and Fib-/- (n = 11) mice at 26 wk; B: Comparative assessment of intestinal wall thickness between Fib+/- (n = 14) and Fib-/- (n = 14) mice at 2 wk and Fib+/- (n = 24) and Fib-/- (n = 11) mice at 26 wk; C: Comparative assessment of intestinal serosal thickness between Fib+/- (n = 14) and Fib-/- (n = 14) mice at 2 wk and Fib+/- (n = 24) and Fib-/- (n = 11) mice at 26 wk.
Figure 4 Intestinal inflammation and intestinal mucosal injury in Fib+/- and Fib-/- mice observed at 2 wk and 26 wk after localized irradiation.
A: Comparative assessment of intestinal inflammation between Fib+/- (n = 13) and Fib-/- (n = 14) mice at 2 wk and Fib+/- (n = 28) and Fib-/- (n = 13) mice at 26 wk by measuring myeloperoxidase activity; B and C: Representative photomicrographs showing myeloperoxidase positive cells in Fib+/- and Fib-/-, respectively, at 2 wk after exposure; D: Comparative assessment of intestinal mucosal injury between Fib+/- (n = 15) and Fib-/- (n = 14) mice at 2 wk and Fib+/- (n = 28) and Fib-/- (n = 11) mice at 26 wk; E and F: Representative photomicrographs showing difference in mucosal surface area by H&E staining in Fib+/- and Fib-/-, respectively, at 2 wk after exposure.
Figure 5 Intestinal smooth muscle cell proliferation, collagen deposition and TGF-β immunoreactivity in Fib+/- and Fib-/- mice observed at 2 wk and 26 wk after localized irradiation.
A: Comparative assessment of intestinal smooth muscle cell proliferation between Fib+/- (n = 13) and Fib-/- (n = 13) mice at 2 wk and Fib+/- (n = 19) and Fib-/- (n = 12) mice at 26 wk by measuring PCNA immunoreactivity; B and C: Representative photomicrographs showing PCNA immunoreactivity in Fib+/- and Fib-/-, respectively, at 2 wk after exposure; D: Comparative assessment of collagen deposition between Fib+/- (n = 11) and Fib-/- (n = 14) mice at 2 wk and Fib+/- (n = 17) and Fib-/- (n = 10) mice at 26 wk; E and F: Representative photomicrographs showing Collagen deposition by Trichrome staining in Fib+/- and Fib-/-, respectively, at 2 wk after exposure; G: Comparative assessment of TGF-β immunoreactivity between Fib+/- (n = 13) and Fib-/- (n = 13) mice at 2 wk and Fib+/- (n = 21) and Fib-/- (n = 12) mice at 26 wk; H and I: Representative photomicrographs showing TGF-β immunoreactivity in Fib+/- and Fib-/-, respectively, at 2 wk after exposure.
- Citation: Wang J, Pathak R, Garg S, Hauer-Jensen M. Fibrinogen deficiency suppresses the development of early and delayed radiation enteropathy. World J Gastroenterol 2017; 23(26): 4701-4711
- URL: https://www.wjgnet.com/1007-9327/full/v23/i26/4701.htm
- DOI: https://dx.doi.org/10.3748/wjg.v23.i26.4701


