Copyright
©The Author(s) 2017.
World J Gastroenterol. Jun 28, 2017; 23(24): 4341-4353
Published online Jun 28, 2017. doi: 10.3748/wjg.v23.i24.4341
Published online Jun 28, 2017. doi: 10.3748/wjg.v23.i24.4341
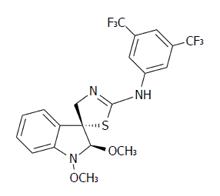
Figure 1 Chemical structure of (±)-trans-1,2-dimethoxy-2’-(3,5-bis-trifluoromethylphenylamino)spiro{indoline-3,5’[4’,5’]dihydrothiazol} (K-453).
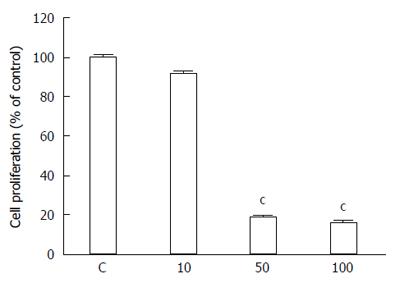
Figure 2 Effect of compound K-453 (c = 40 μmol/L) on HCT116 cell proliferation using BrdU incorporation assay.
Data were obtained from three independent experiments, and significant differences were marked as cP < 0.001 vs control cells (untreated).
Figure 3 Cell cycle distribution in HCT116 cells treated with compound K-453 at concentration 40 μmol/L after 24, 48 and 72 h.
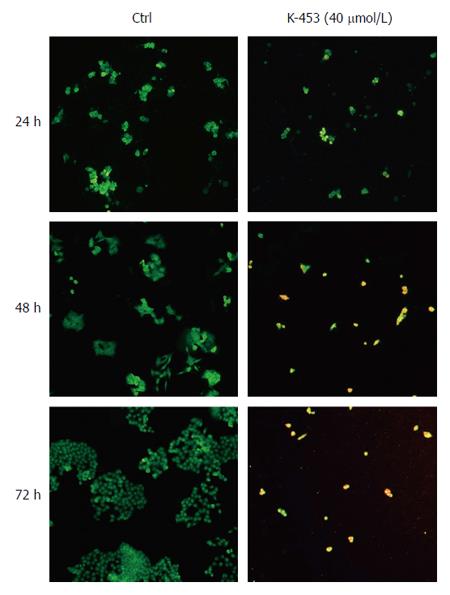
Figure 4 Microscopic detection of apoptosis using AO/PI staining in HCT116 cells 24, 48 and 72 h after treatment with compound K-453.
Green = live, yellow = early apoptotic, orange = late apoptotic, red = death.
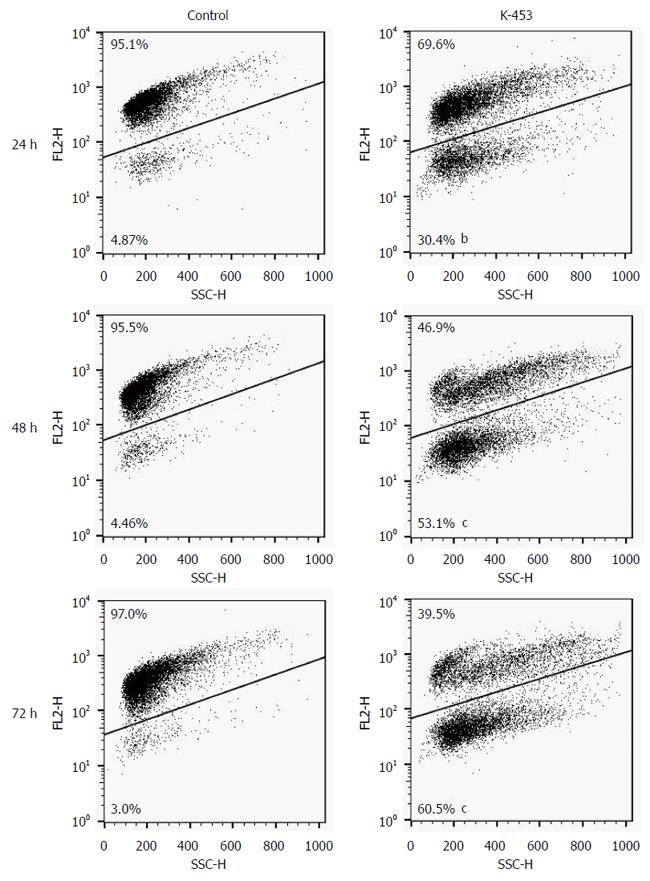
Figure 5 Representative dot-blot diagram of mitochondrial membrane potential changes after K-453 treatment.
Data were obtained from three independent experiments, and significant differences were marked as bP < 0.01, cP < 0.001 vs control cells (untreated).
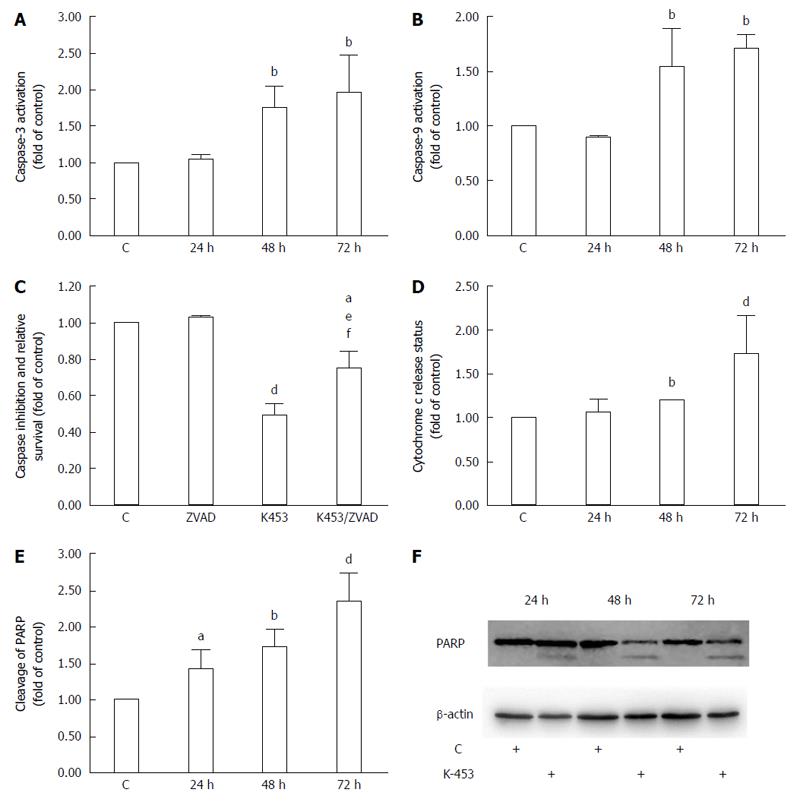
Figure 6 Effect of K-453 treatment on caspase activity and PARP cleavage.
A: Activation of caspase-3; B: caspase-9 evaluated by flow cytometric analysis in HCT116 cells 24, 48 and 72 h after treatment; C: Analysis of caspase inhibition evaluated by MTS after 72 h treatment; D: Release of cytochrome c evaluated by flow cytometric analysis in HCT116 cells 24, 48 and 72 h after treatment; E: Cleavage of PARP evaluated by flow cytometric analysis 24, 48 and 72 h after treatment. Data represents the mean ± SD compared to the control of 3 independent experiments; F: Cleavage of PARP evaluated by Western blot analysis. Significance: aP < 0.05, bP < 0.01, dP < 0.001 vs untreated cells (control); eP < 0.05 vs ZVAD; fP < 0.01 vs K453.
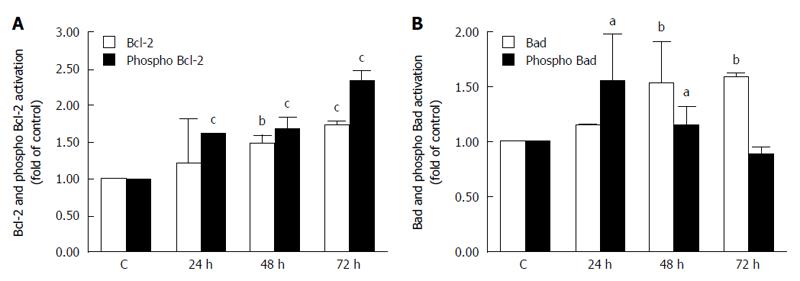
Figure 7 Analysis of mitochondrial apoptotic pathway associated proteins.
Relative levels and activation of Bcl-2 (A) or Bad (B) proteins after K-453 treatment. Significance: aP < 0.05, bP < 0.01, cP < 0.001 vs untreated cells (control).
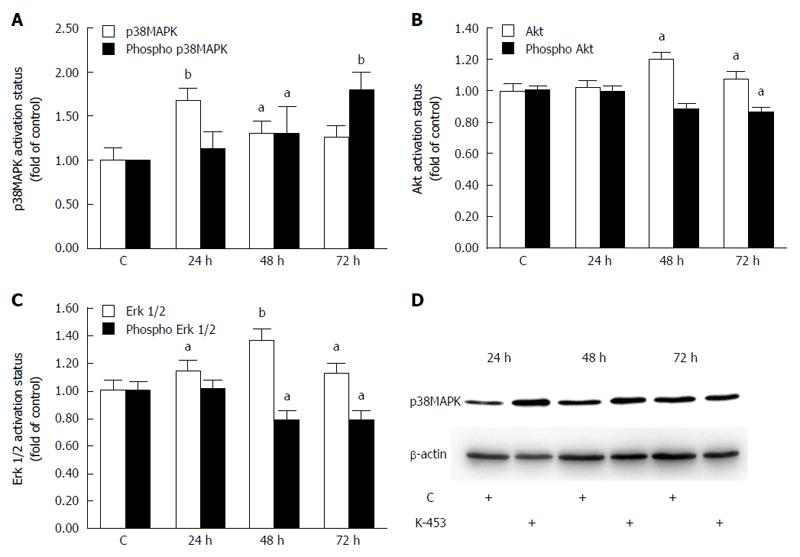
Figure 8 Relative levels and phosphorylation status of p38 MAPK (A, D), Akt (B) and ERK 1/2 (C) proteins after 24, 48, 72 h treatment with K-453.
Significance: aP < 0.05, bP < 0.01 vs untreated cells (control).
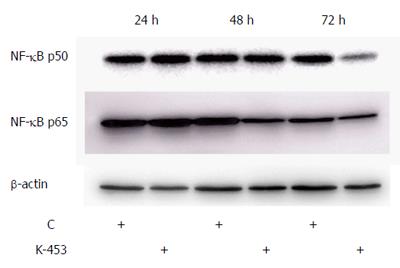
Figure 9 Western blot analysis of NF-κB1 (p50) and RelA (p65) down-regulation in cell lysates obtained from HCT116 cell culture for 24, 48 and 72 h with compound K-453 (c = 40 μmol/L).
- Citation: Tischlerova V, Kello M, Budovska M, Mojzis J. Indole phytoalexin derivatives induce mitochondrial-mediated apoptosis in human colorectal carcinoma cells. World J Gastroenterol 2017; 23(24): 4341-4353
- URL: https://www.wjgnet.com/1007-9327/full/v23/i24/4341.htm
- DOI: https://dx.doi.org/10.3748/wjg.v23.i24.4341


