Copyright
©The Author(s) 2017.
World J Gastroenterol. Jan 14, 2017; 23(2): 286-296
Published online Jan 14, 2017. doi: 10.3748/wjg.v23.i2.286
Published online Jan 14, 2017. doi: 10.3748/wjg.v23.i2.286
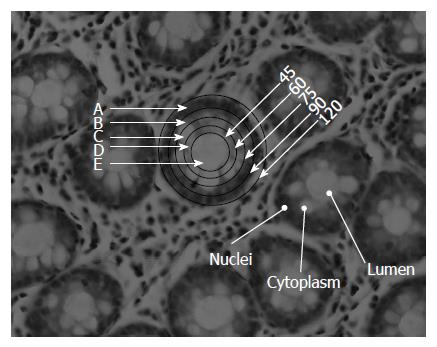
Figure 1 Histological section of H&E stained colonic biopsy showing the architecture of crypts in a transverse section.
The different zones indicated by letters show the part of the crypt that likely has a different metabolic pattern. The numbers indicate the size of the microscopic aperture that is used to obtain the spectra of the portion of the crypt. The circle consists of several cells joined in a concentric manner around the lumen with their nuclei in a peripheral configuration to the lumen. N: Nucleus; L: Lumen; C: Cytoplasm.
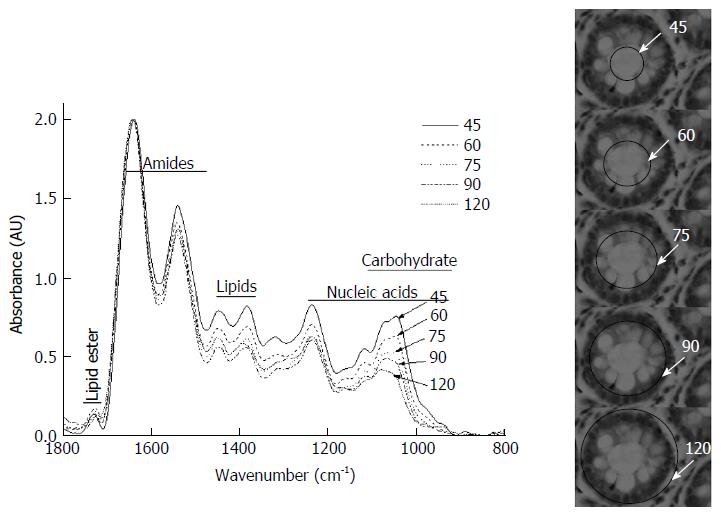
Figure 2 Amide I normalized spectra of a representative crypt with a lumen diameter of 45 μm and an outer diameter of 120 μm.
The histological sections on the right show the aperture of the microscope and the corresponding region of the crypt along with the spectra obtained for the same. The notations for the regions in the figure correspond to those of the spectra displayed in Figure 2. The spectra are normalized with respect to Amide I. Numbers indicate the size of the aperture.
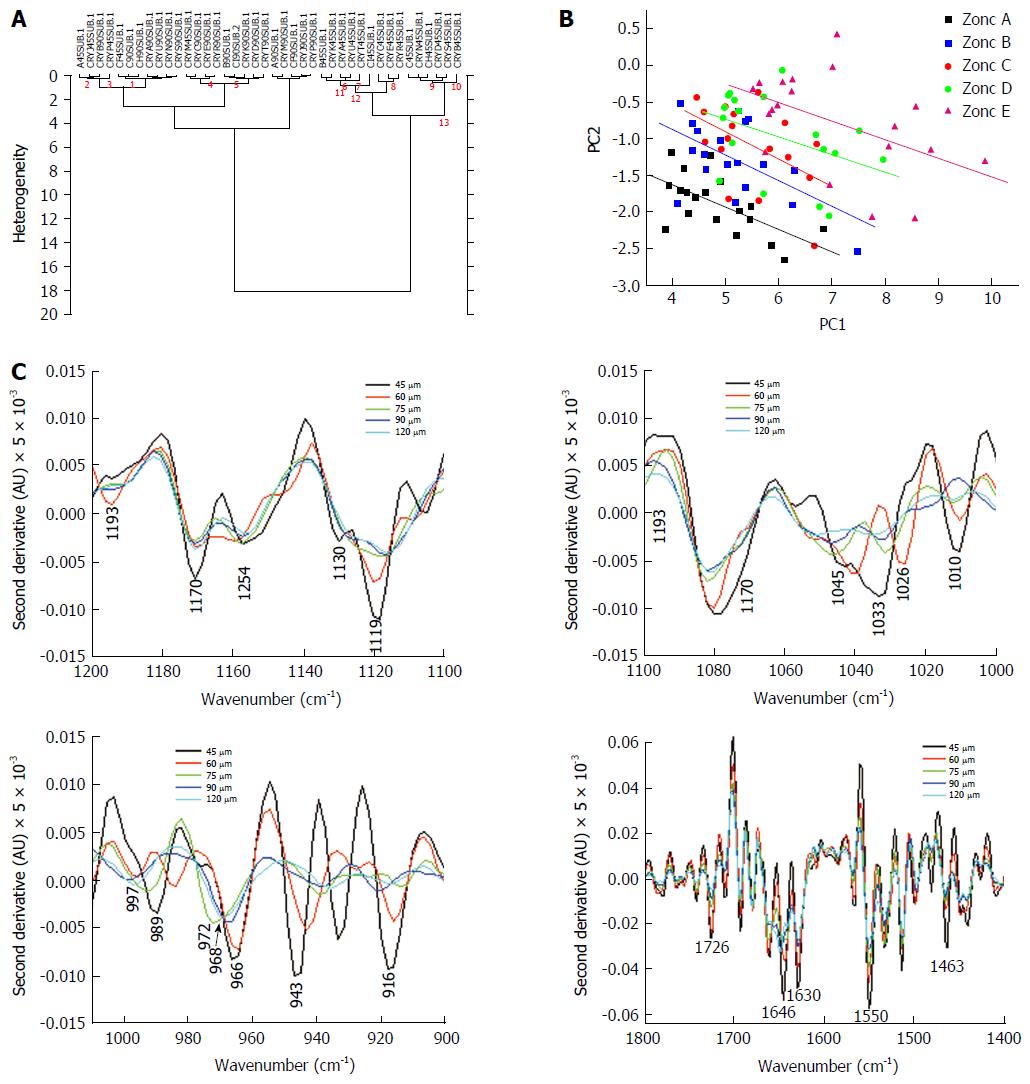
Figure 3 Variation of the spectra due to aperture.
A: Cluster analysis of spectra obtained with apertures of 45 and 90 μm to show the variation if composition between zones and similarity within zones. Forty-five and ninety numbers indicate the apertures in the labels of crypts; B: PCA analysis of the spectra showing the variation in biochemistry along the crypt diameter. The lines are drawn to show the group and are not mathematical in origin; C: Second derivative of the normalized spectra obtained with various apertures, in the region between 900-1200 cm-1 showing the different wave numbers where the carbohydrates and nucleic acids absorb and how these vary due to the aperture.
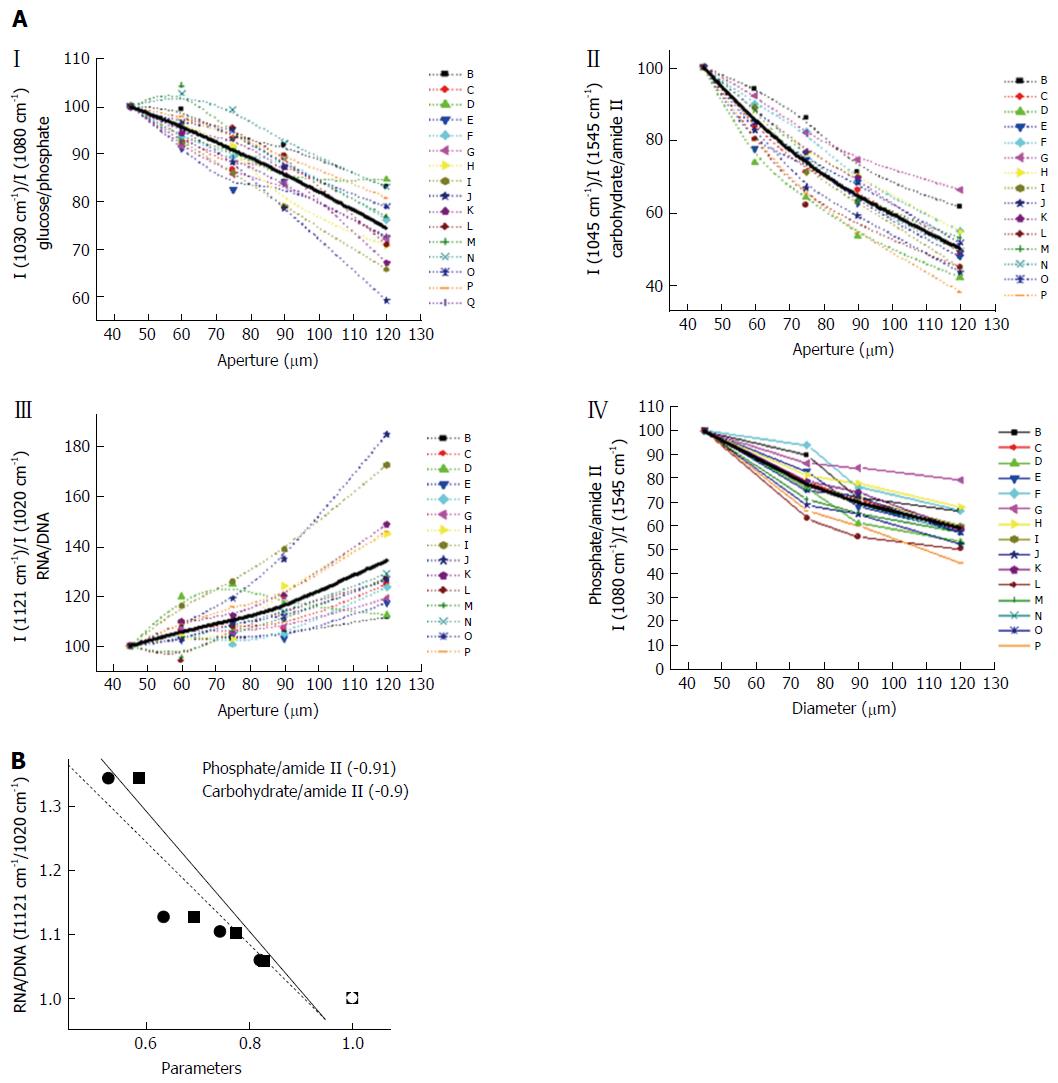
Figure 4 Analysis of different parameters to indicate the changes in composition within a crypt.
A: Distribution of different metabolites in the various zones: Glucose/phosphate [I (1030 cm-1)/I (1080 cm-1)], Carbohydrates/amide II [I (1045 cm-1)/I (1545 cm-1)], RNA/DNA [I (1121 cm-1)/I (1020 cm-1)], and Phosphate/amide II [I (1080 cm-1)/I (1545 cm-1)]. Each line represents a crypt and the dark line represents the average. A few crypts are shown along with the averages to indicate the pattern; B: Correlation between different parameters (Solid square-phosphate/amide II and solid circle-carbohydrate/amide II) and the RNA/DNA ratio along the crypt. The lines are only an indicator of the trends. The values within the box indicate the correlation coefficients of the different parameters with the RNA/DNA ratio.
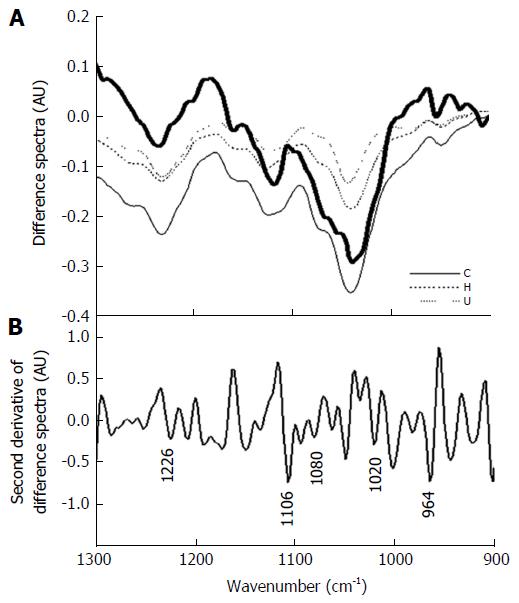
Figure 5 Extrapolation of the principle/observations to disease conditions.
A: Difference spectra between normal, IBD (Crohn's-H and Ulcerative colitis-UC) and cancer (C) tissues showing similar pattern to the difference spectra obtained by subtracting normalized spectra with apertures 120 and 90 μm (bold black line); B: Second derivative of the difference spectra of 120 and 90 μm showing peaks corresponding to nucleic acid absorbance (DNA-1020, 1080, 964). The difference spectra of IBD, normal and Crohn’s represent the average spectra for each category from ten different patients subtracted from the average normal spectra.
- Citation: Sahu RK, Salman A, Mordechai S. Tracing overlapping biological signals in mid-infrared using colonic tissues as a model system. World J Gastroenterol 2017; 23(2): 286-296
- URL: https://www.wjgnet.com/1007-9327/full/v23/i2/286.htm
- DOI: https://dx.doi.org/10.3748/wjg.v23.i2.286


