Copyright
©The Author(s) 2017.
World J Gastroenterol. Jan 14, 2017; 23(2): 265-274
Published online Jan 14, 2017. doi: 10.3748/wjg.v23.i2.265
Published online Jan 14, 2017. doi: 10.3748/wjg.v23.i2.265
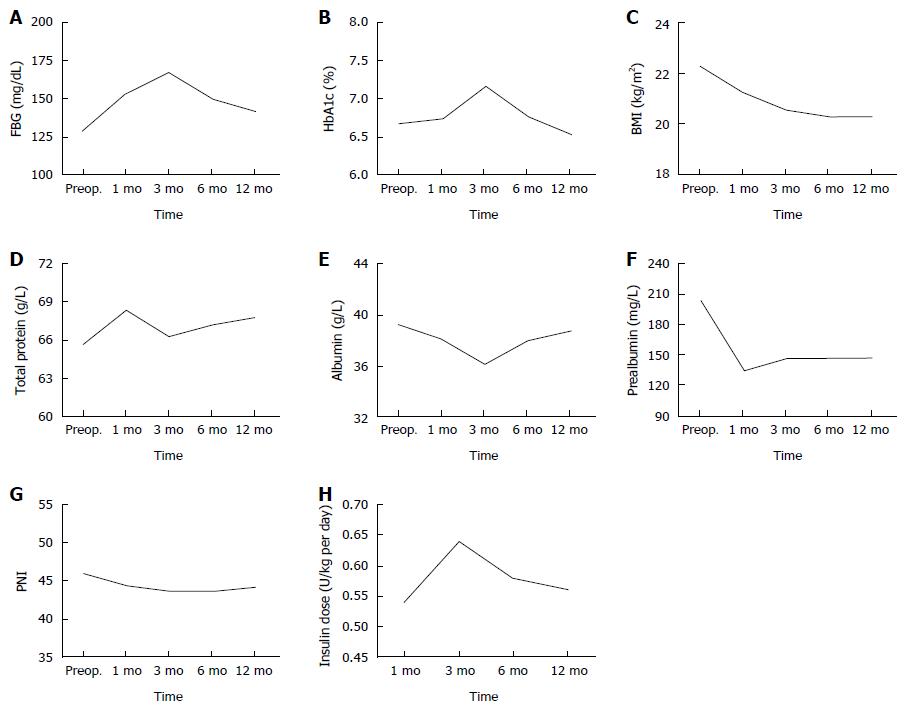
Figure 1 Changes in clinical parameters after total pancreatectomy.
A: FBG; B: HbA1c; C: BMI; D: Total protein; E: Albumin; F: Prealbumin; G: PNI; H: Insulin dose. FBG: Fasting blood glucose; BMI: Body mass index; PNI: Prognostic nutritional index
Figure 2 Time axis of the checkpoints in the analysis.
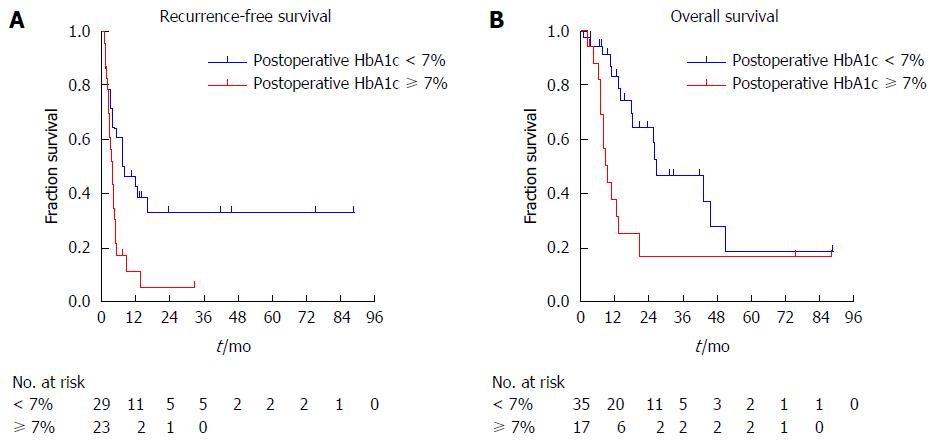
Figure 3 Kaplan-Meier survival curves of patients undergoing total pancreatectomy.
A: Recurrence-free survival curves of patients with postoperative HbA1c over 7% and less than 7%; B: Overall survival curves of patients with postoperative HbA1c over 7% and less than 7%.
- Citation: Shi HJ, Jin C, Fu DL. Impact of postoperative glycemic control and nutritional status on clinical outcomes after total pancreatectomy. World J Gastroenterol 2017; 23(2): 265-274
- URL: https://www.wjgnet.com/1007-9327/full/v23/i2/265.htm
- DOI: https://dx.doi.org/10.3748/wjg.v23.i2.265


