Copyright
©The Author(s) 2017.
World J Gastroenterol. Jan 14, 2017; 23(2): 204-215
Published online Jan 14, 2017. doi: 10.3748/wjg.v23.i2.204
Published online Jan 14, 2017. doi: 10.3748/wjg.v23.i2.204
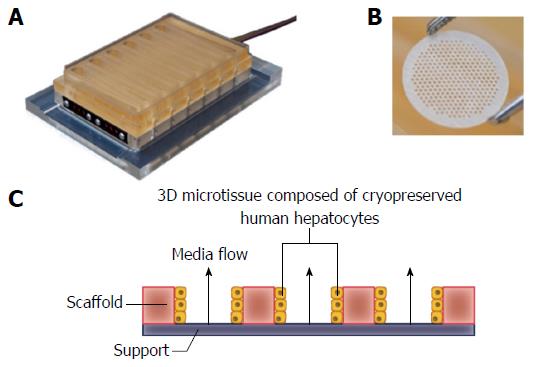
Figure 1 LiverChip® three-dimensional perfused cell culture system.
A: The LiverChip® plate contains 12 independent bioreactors for the 3D culture of hepatocytes; B: Hepatocytes form 3D micro-tissue structures in an array of channels in a collagen I-coated scaffold that is contained in each LiverChip® well; C: Schematic representation of how media flows through the channels of each LiverChip scaffold due to the action of a pneumatically operated pumps in the base of the plate. The speed and direction of flow can be adjusted using an electronic controller. 3D: Three-dimensional.
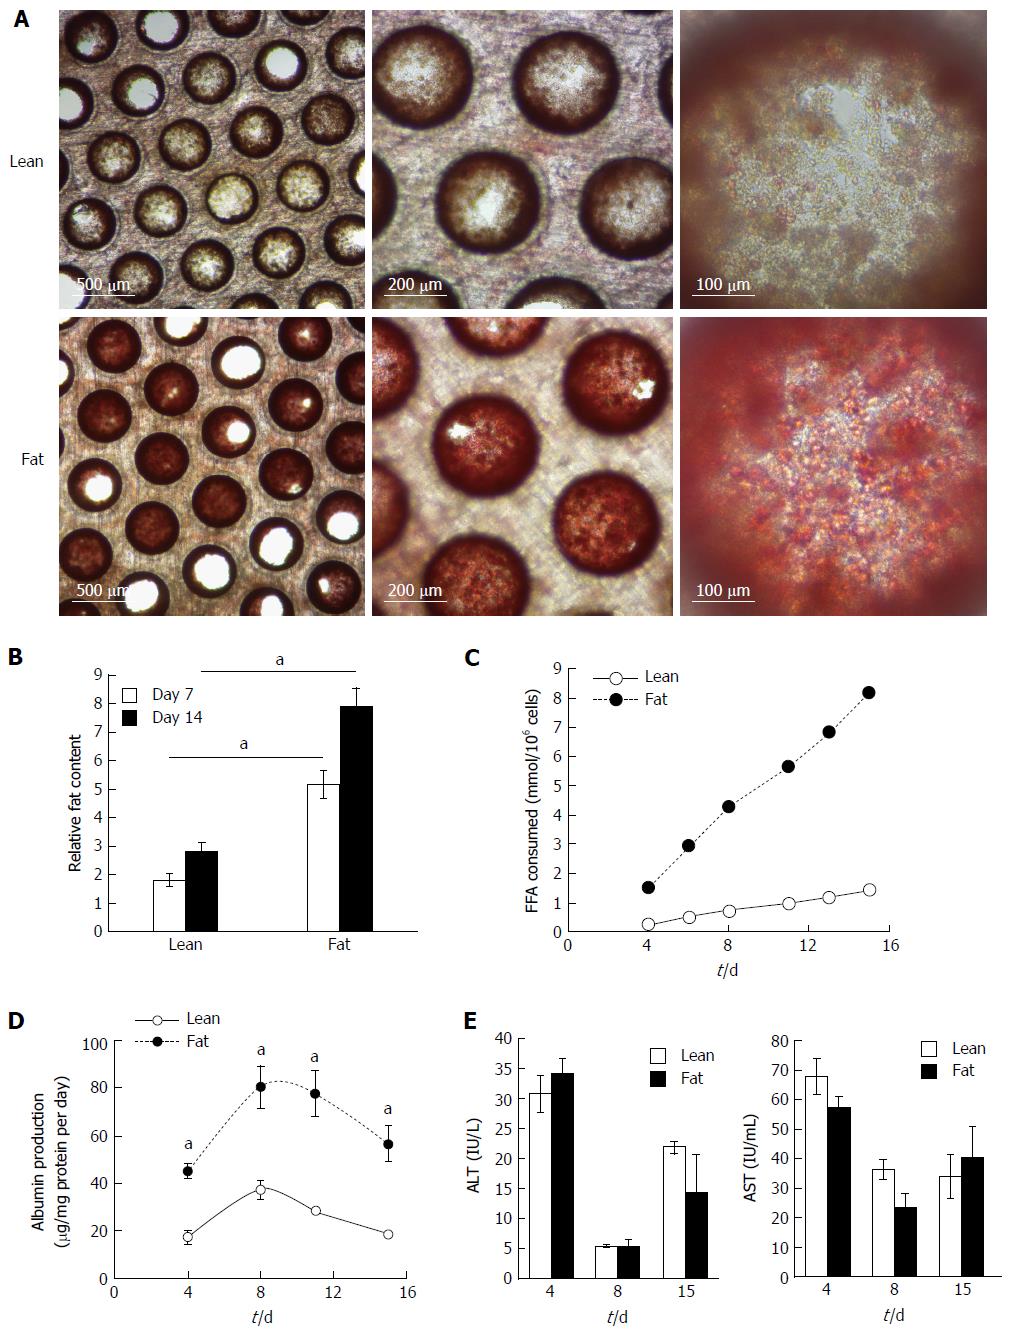
Figure 2 Hepatocytes accumulate intracellular fat over time.
Hepatocytes were cultured for 14 d under fat and lean conditions. Fat loading was measured by Oil Red O staining of microtissues, which were observed by microscopy (A), and quantified by absorbance at 510 nm and normalised to total cellular protein to give a relative fat content (B). Fat consumed by cells over 14 d of culture was calculated by analysing culture medium at each media change for the presence of free fatty acids using enzyme-based colorimetric assay (C). Hepatocytes were compared for albumin (D) and ALT/AST production (E). Each time point is a mean of 6 independent cultures ± SD (aP < 0.01).
Figure 3 Hepatocytes cultured in fat media have altered gene expression profiles.
Hepatocytes were cultured in fat or lean conditions for 7 d before total RNA was extracted and gene expression was compared using Fatty Liver RT2 Profiler PCR Arrays. A: Gene expression changes were defined by a fold change > 1.95 and P ≤ 0.05; B: Fold change in expression in fat vs lean condition of key genes, filled bars = fat, white bars = lean. Data are mean ± SD from nine independent cultures (three donors per condition and n = 3 per donor).
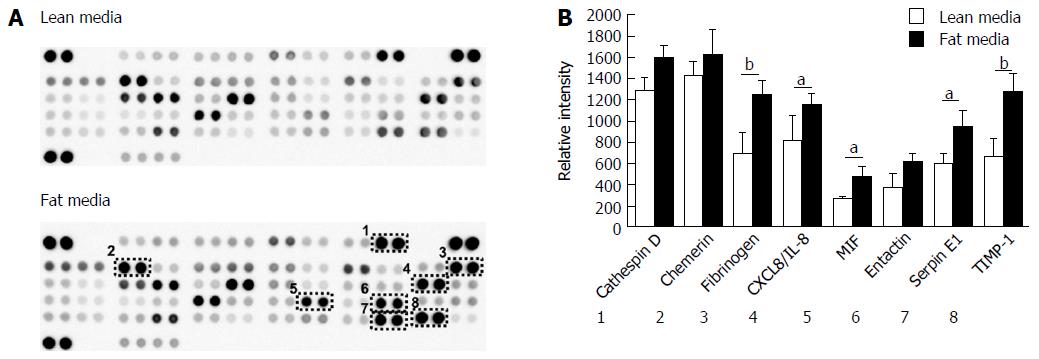
Figure 4 Hepatocytes cultured in fat media secrete increased concentration of adipokines.
A: Hepatocytes were cultured in fat or lean conditions for 7 d and secreted protein production was compared by antibody-based adipokine array analysis; B: Adipokine levels were expressed as the relative densitometric intensity. Data are mean ± SEM from nine independent cultures (three donors per condition and n = 3 per donor); aP < 0.05, bP < 0.01.
Figure 5 Fat alters the metabolic capacity of hepatocytes.
Hepatocytes were cultured in fat or lean conditions for 7 d. A: CYP3A activity was measured in three donors by CYP3A-Glo assay (n = 3 per donor); B: P450 activity of cells was compared using an LC-MS/MS cocktail assay. Production of key metabolites from probe compounds was measured after 2 h exposure and normalised to total cellular protein content. Data is a mean (n = 3) ± SD, aP < 0.05.
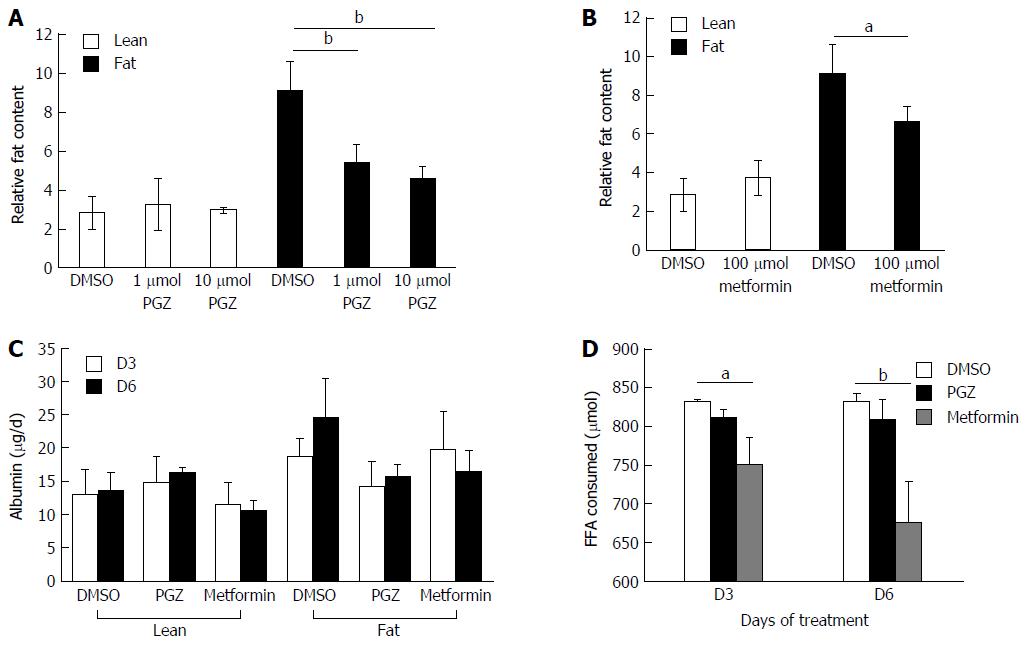
Figure 6 Pioglitazone and Metformin can reduce steatosis in three-dimensional non-alcoholic fatty liver disease model.
Hepatocytes were cultured for 7 d in fat or lean conditions, before treatment with anti-steatotic compounds, Pioglitazone (PGZ) (A) and Metformin (B). Cells were treated for 7 d in the continued presence/absence of fat. Fat content in all wells was analysed by Oil Red O staining and normalised to total cellular protein content. Albumin production in treated cultures (data shown for 10 μmol PGZ treated samples) (C). Fat consumed by cells during treatment was calculated by analysing culture medium for the presence of free fatty acids using enzyme-based colorimetric assay (D). Data is a mean ± SD (n = 3), aP < 0.05, bP < 0.01.
- Citation: Kostrzewski T, Cornforth T, Snow SA, Ouro-Gnao L, Rowe C, Large EM, Hughes DJ. Three-dimensional perfused human in vitro model of non-alcoholic fatty liver disease. World J Gastroenterol 2017; 23(2): 204-215
- URL: https://www.wjgnet.com/1007-9327/full/v23/i2/204.htm
- DOI: https://dx.doi.org/10.3748/wjg.v23.i2.204


