Copyright
©The Author(s) 2017.
World J Gastroenterol. May 21, 2017; 23(19): 3488-3495
Published online May 21, 2017. doi: 10.3748/wjg.v23.i19.3488
Published online May 21, 2017. doi: 10.3748/wjg.v23.i19.3488
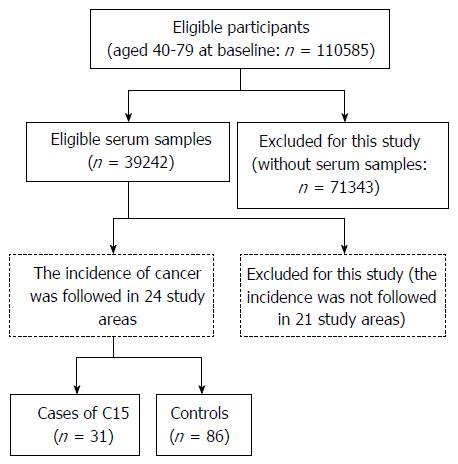
Figure 1 Flow chart for selection of cases and control.
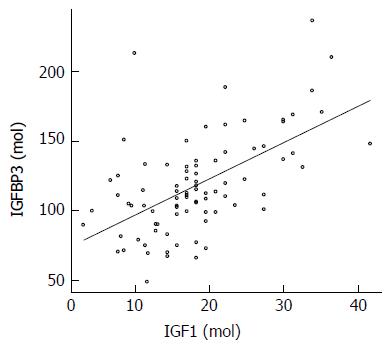
Figure 2 A scatter plot of insulin-like growth factor-1/insulin-like growth factor-binding protein-3.
Spearman correlation coefficients between IGFBP3 and IGF1 among controls is 0.541 (P < 0.0001).
- Citation: Adachi Y, Nojima M, Mori M, Yamashita K, Yamano HO, Nakase H, Endo T, Wakai K, Sakata K, Tamakoshi A. Insulin-like growth factor-1, IGF binding protein-3, and the risk of esophageal cancer in a nested case-control study. World J Gastroenterol 2017; 23(19): 3488-3495
- URL: https://www.wjgnet.com/1007-9327/full/v23/i19/3488.htm
- DOI: https://dx.doi.org/10.3748/wjg.v23.i19.3488


