Copyright
©The Author(s) 2017.
World J Gastroenterol. May 21, 2017; 23(19): 3449-3467
Published online May 21, 2017. doi: 10.3748/wjg.v23.i19.3449
Published online May 21, 2017. doi: 10.3748/wjg.v23.i19.3449
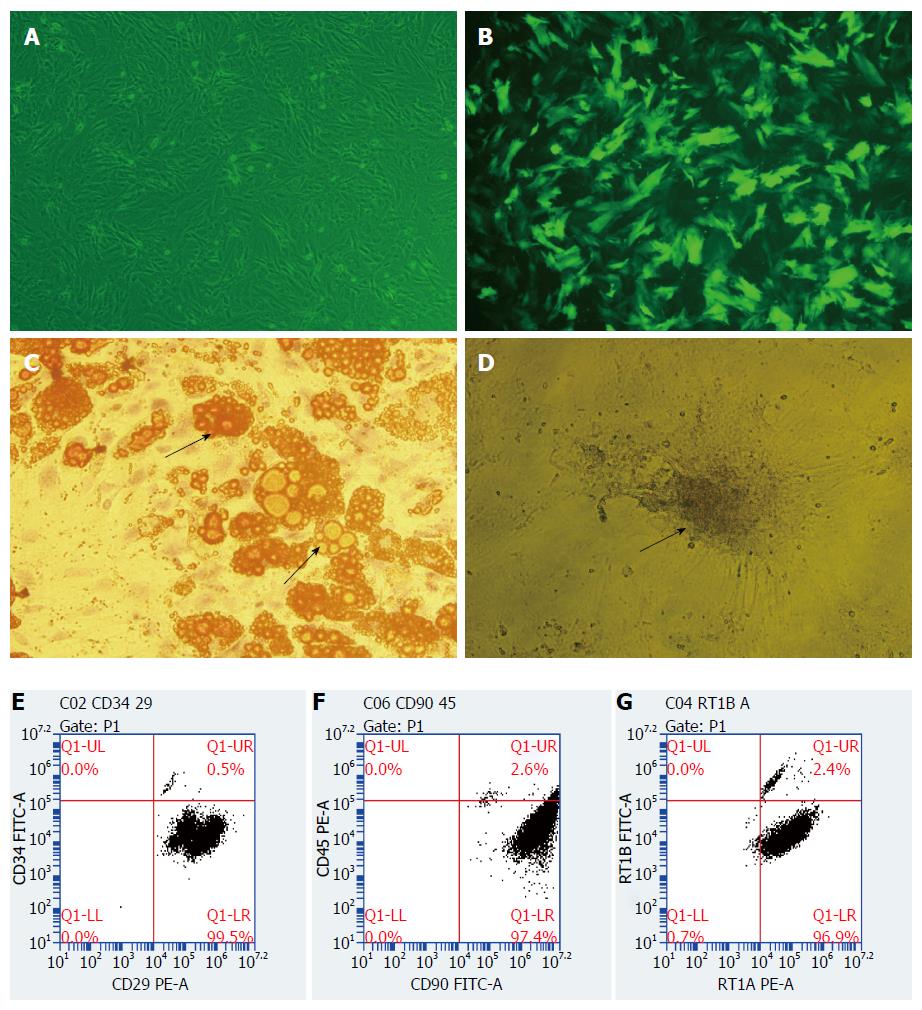
Figure 1 Morphology, transformation, and flow cytometric analysis of bone marrow-derived mesenchymal stem cells.
A: The third generation of bone marrow-derived mesenchymal stem cells (BMMSCs) (normal field, × 100): BMMSCs grew to complete adherence, and the cells were spindle-shaped, some were in a vortex or daisy-likearrangement; B: HO-1/BMMSCs (fluorescence field, × 100): more than 80% of the BMMSCs expressed green fluorescence after transduction with HO-1; C: Adipogenic induction of BMMSCs, with orange lipid droplets stained by Oil red O in cytoplasm (× 200, shown by an arrow); D: Osteogenic induction of BMMSCs, with black calcium deposits in cytoplasm stained by von Kossa’s reagent (× 200, shown by an arrow); E: The percentage of CD29+CD34- cells was 99.5%; F: The percentage of CD90+CD45- cells was 97.4%; G: The percentage of RT1A+RT1B- cells was 96.9%.
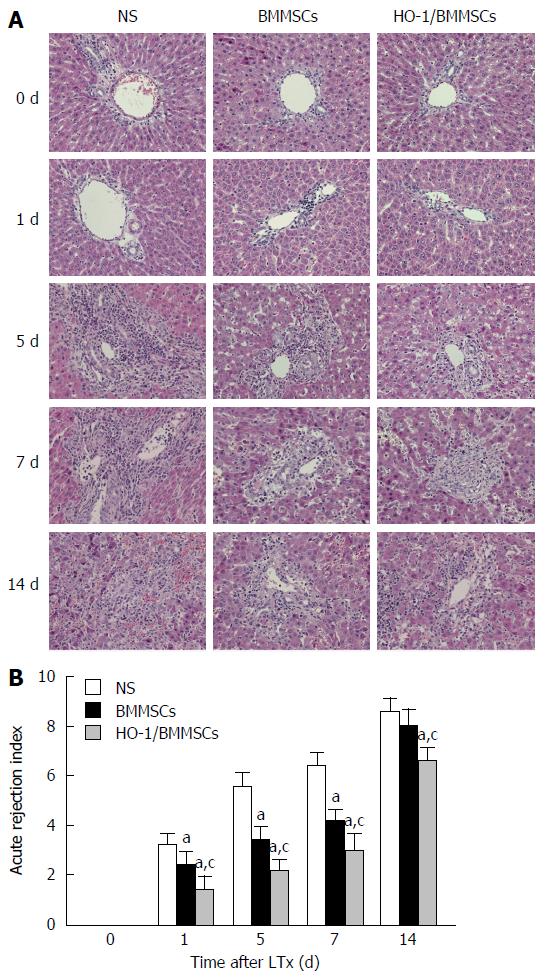
Figure 2 Histological changes of the rat liver and grading of acute cellular rejection after reduced size liver transplantation.
A: Hematoxylin and eosin staining of the transplanted liver (× 200): Rejection injuries were aggravated with increased post-operative time in all three groups. Histopathologically, the transplanted liver in the NS group showed obvious congestion in the hepatic sinus, hepatocyte swelling, mainly eosinophilic degeneration, and punctate necrosis. The infiltration of a large volume of mixed lymphocytes in the central vein and the portal area was accompanied by disordered hepatic lobules and necrosis of hepatocytes on postoperative day (POD) 5. Infiltration of inflammatory cells and necrosis of hepatocytes deteriorated on POD7. The mixed lymphocyte infiltration became significant on POD14, with severe hepatic sinus congestion, hepatocyte destruction, and disappearance of the lobular structure. Inflammatory cells infiltration, hepatocyte destruction, and lobular destruction of the transplanted liver in BMMSCs group were less severe than those in the NS group. HO-1/BMMSCs group showed less rejection, and fewer injuries of liver allografts compared with the BMMSCs and NS groups at each time point, without obvious hepatic sinus congestion, large volume of inflammatory cells infiltration, or disorder of the lobular structure; B: Grading of acute cellular rejection (ACR): The rejection injuries tended to deteriorate with increasing post-operative time in all groups. Rejection in the HO-1/BMMSCs group was significantly less severe than that in the BMMSCs and NS groups at all time points (P < 0.05). POD1: HO-1/BMMSCs group vs BMMSCs group vs NS group: 1.40 ± 0.55 vs 2.40 ± 0.55 vs 3.20 ± 0.45 (P < 0.05). POD5: HO-1/BMMSCs group vs BMMSCs group vs NS group: 2.20 ± 0.45 vs 3.40 ± 0.55 vs 5.60 ± 0.55 (P < 0.01). POD7: HO-1/BMMSCs group vs BMMSCs group vs NS group: 3.00 ± 0.71 vs 4.20 ± 0.45 vs 6.40 ± 0.55 (P < 0.01). POD14: HO-1/BMMSCs group vs NS group: 6.60 ± 0.55 vs 8.60 ± 0.55 (P < 0.01); HO-1/BMMSCs group vs BMMSCs group: 6.60 ± 0.55 vs 8.00 ± 0.71 (P < 0.01). aP < 0.05 vs NS group, cP < 0.05 vs HO-1/BMMSCs group.
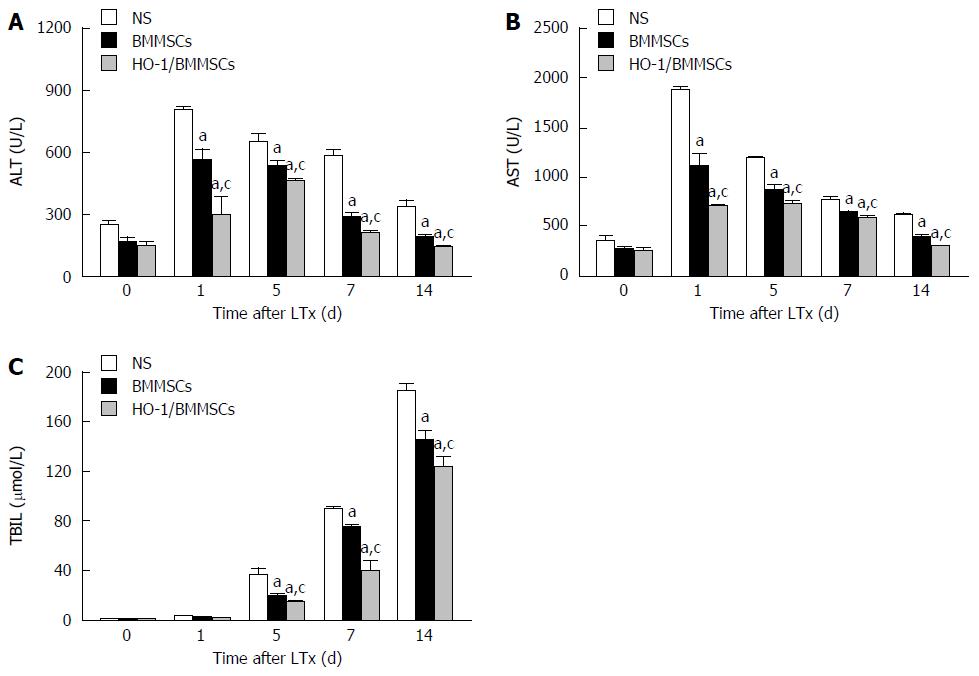
Figure 3 The level of liver function indexes after liver transplantation.
A: Alanine aminotransferase (ALT); B: Aspartate aminotransferase (AST); C: Total bilirubin (TBIL). The serum ALT and AST in the three groups increased initially and then decreased with increasing post-operative time. The serum liver enzymes in the HO-1/BMMSCs group were the lowest, and NS group were the highest on postoperative day (POD) 1, 5, 7, and 14 (P < 0.05). TBIL showed a trend to increase with time. TBIL of the HO-1/BMMSCs group were the lowest, and were highest in the NS group on POD5, 7 and 14 (P < 0.05). aP < 0.05 vs NS group, cP < 0.05 vs HO-1/BMMSCs group.
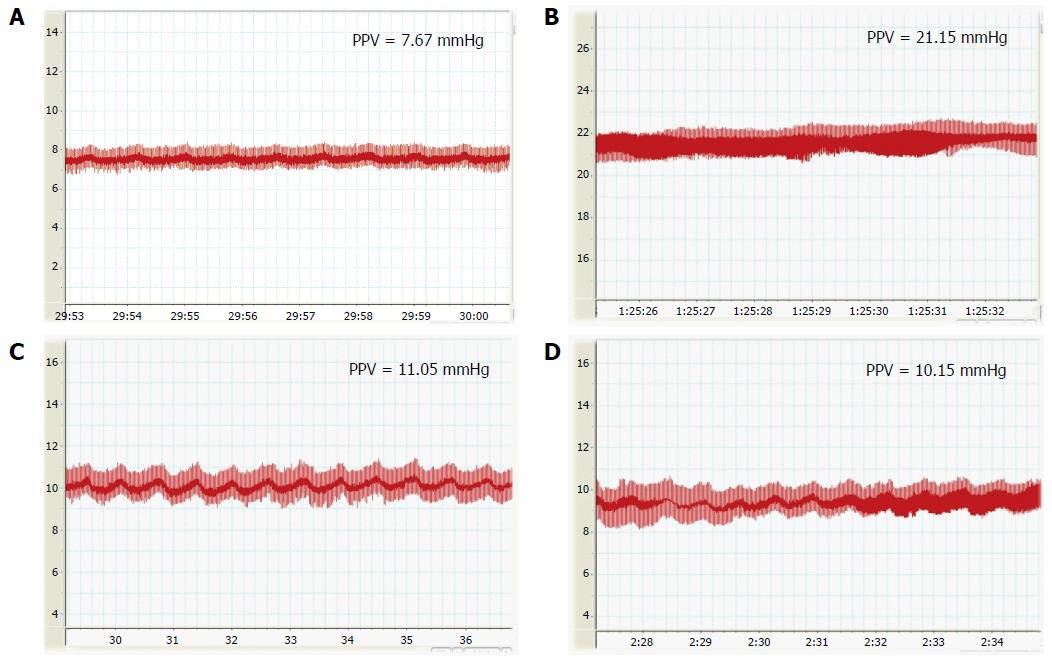
Figure 4 Portal vein pressure on the 7th d after liver transplantation.
A: Portal vein pressure (PVP) of normal BN rats; B: PVP of normal saline (NS) group on postoperative day (POD) 7; C: PVP of bone marrow-derived mesenchymal stem cells (BMMSCs) group on POD7; D: PVP of HO-1/BMMSCs group on POD7. PVP of both the HO-1/BMMSCs group and the BMMSCs group was significantly lower than that of NS group on POD7 (P < 0.05). HO-1/BMMSCs group vs NS group: 10.67 ± 0.35 vs 21.26 ± 0.20 (P < 0.01); BMMSCs group vs NS group: 10.95 ± 0.22 vs 21.26 ± 0.20 (P < 0.01).
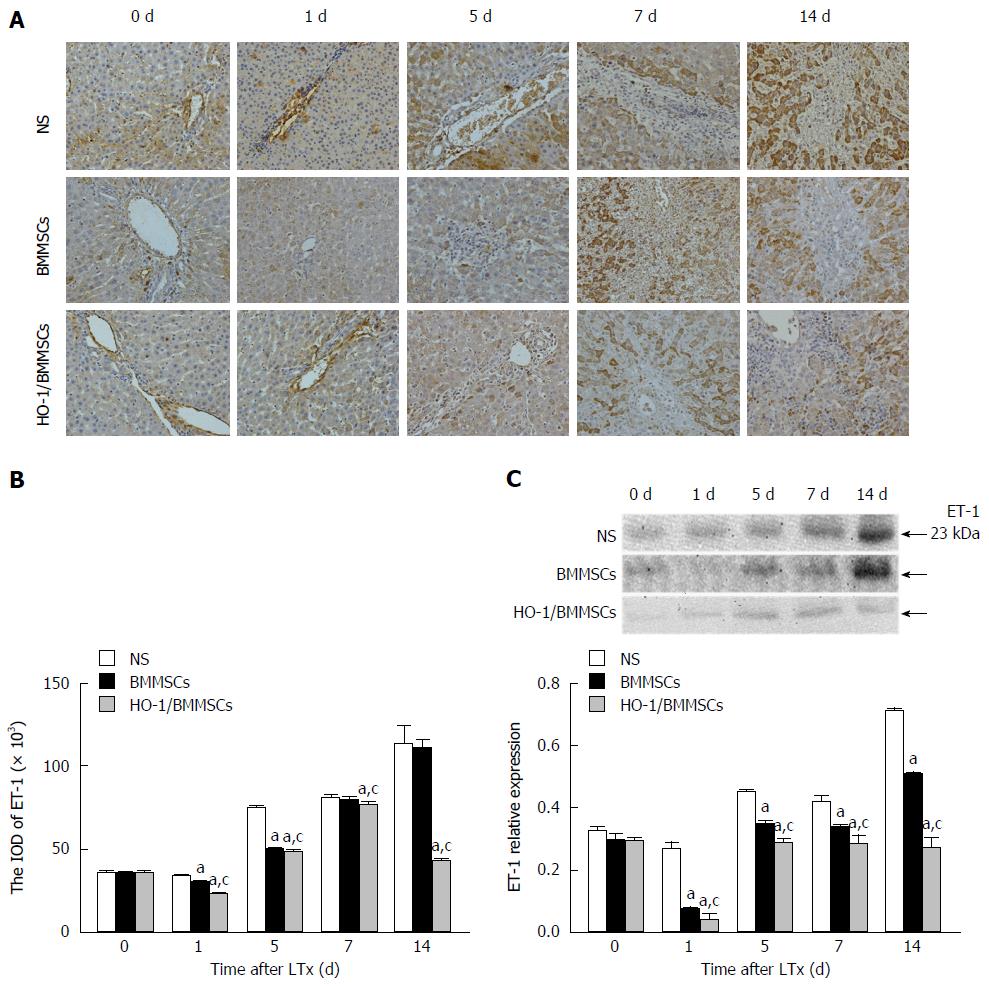
Figure 5 Endothelin-1 expression in the liver after liver transplantation.
A: Immunohistochemistry (IHC) of endothelin-1 (ET-1); B: IHC integrated optical density (IOD) of ET-1; C: ET-1 protein levels. ET-1 protein levels: postoperative day (POD) 1: HO-1/BMMSCs group vs BMMSCs group vs NS group: 0.04 ± 0.02 vs 0.07 ± 0.01 vs 0.27 ± 0.02 (P < 0.05). POD5: HO-1/BMMSCs group vs BMMSCs group vs NS group: 0.29 ± 0.01 vs 0.35 ± 0.01 vs 0.45 ± 0.01 (P < 0.01). POD7: HO-1/BMMSCs group vs BMMSCs group vs NS group: 0.28 ± 0.03 vs 0.34 ± 0.01 vs 0.42 ± 0.02 (P < 0.05). POD14: HO-1/BMMSCs group vs BMMSCs group vs NS group: 0.27 ± 0.04 vs 0.51 ± 0.01 vs 0.71 ± 0.01 (P < 0.01). aP < 0.05 vs NS group, cP < 0.05 vs HO-1/BMMSCs group.
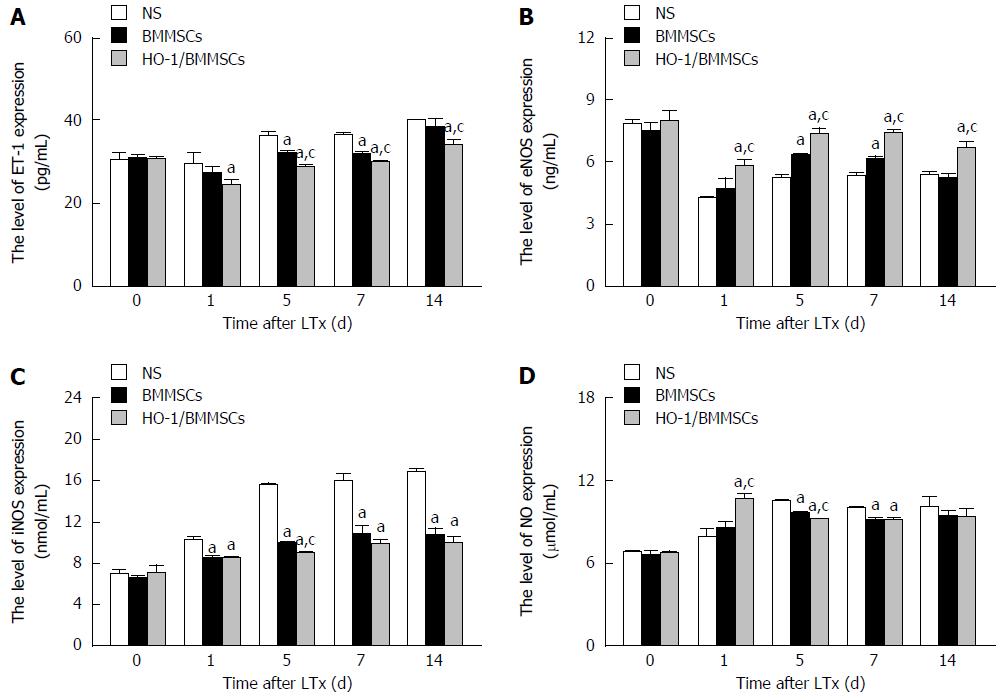
Figure 6 Endothelin-1/nitrous oxide related factors expression in serum after liver transplantation.
A: Expression of endothelin-1 (ET-1); B: Expression of endothelial nitric-oxide synthase (eNOS); C: Expression of inducible nitric-oxide synthase (iNOS); D: Expression of NO. The serum ET-1 after RLT decreased initially and then increased with the extension of post-operative time. Postoperative day (POD) 1: HO-1/BMMSCs group vs NS group: 24.53 ± 1.22 vs 29.29 ± 2.97 (P < 0.01). POD5: HO-1/BMMSCs vs BMMSCs vs NS group: 28.84 ± 0.17 vs 32.18 ± 0.30 vs 36.27 ± 0.92 (P < 0.01). POD7: HO-1/BMMSCs group vs BMMSCs group vs NS group: 29.92 ± 0.28 vs 31.87 ± 0.50 vs 36.25 ± 0.54 (P < 0.01). POD14: HO-1/BMMSCs group vs NS group: 33.82 ± 1.44 vs 40.03 ± 0.17 (P < 0.01); HO-1/BMMSCs group vs BMMSCs group: 33.82 ± 1.44 vs 38.35 ± 2.09 (P < 0.01). The serum levels of eNOS increased with the extension of post-operative time. POD1: HO-1/BMMSCs group vs NS group: 5.86 ± 0.30 vs 4.30 ± 0.07 (P < 0.01); HO-1/BMMSCs group vs BMMSCs group: 5.86 ± 0.30 vs 4.74 ± 0.54 (P < 0.01). POD5: HO-1/BMMSCs vs BMMSCs vs NS group: 7.39 ± 0.29 vs 6.36 ± 0.07 vs 5.27 ± 0.16 (P < 0.01). POD7: HO-1/BMMSCs group vs BMMSCs group vs NS group: 7.43 ± 0.19 vs 6.17 ± 0.12 vs 5.37 ± 0.12 (P < 0.01). POD14: HO-1/BMMSCs group vs NS group: 6.72 ± 0.30 vs 5.40 ± 0.15 (P < 0.01); HO-1/BMMSCs group vs BMMSCs group: 6.72 ± 0.30 vs 5.26 ± 0.20 (P < 0.01). The serum levels of iNOS increased with the extension of post-operative time, and was most significant in NS group. POD1: HO-1/BMMSCs group vs NS group: 8.57 ± 0.07 vs 10.24 ± 0.42 (P < 0.01); BMMSCs group vs NS group: 8.56 ± 0.20 vs 10.24 ± 0.42 (P < 0.01). POD5: HO-1/BMMSCs vs BMMSCs vs NS group: 9.06 ± 0.05 vs 9.97 ± 0.08 vs 15.66 ± 0.13 (P < 0.01). POD7: HO-1/BMMSCs group vs NS group: 9.87 ± 0.42 vs 15.96 ± 0.74 (P < 0.01); BMMSCs group vs NS group: 10.85 ± 0.90 vs 15.96 ± 0.74 (P < 0.01). POD14: HO-1/BMMSCs group vs NS group: 10.04 ± 0.61 vs 16.85 ± 0.31 (P < 0.05); BMMSCs group vs NS group: 10.73 ± 0.64 vs 16.85 ± 0.31 (P < 0.01). The serum levels of NO tended to increase initially and then decrease with the extension of post-operative time. POD1: HO-1/BMMSCs group vs NS group: 10.64 ± 0.36 vs 7.92 ± 0.59 (P < 0.01); HO-1/BMMSCs group vs BMMSCs group: 10.64 ± 0.36 vs 8.56 ± 0.44 (P < 0.01). POD5: HO-1/BMMSCs vs BMMSCs vs NS group: 9.17 ± 0.08 vs 9.65 ± 0.09 vs 10.50 ± 0.07 (P < 0.01). POD7: HO-1/BMMSCs group vs NS group: 9.19 ± 0.12 vs 10.00 ± 0.10 (P < 0.01); BMMSCs group vs NS group: 9.41 ± 0.39 vs 10.00 ± 0.10 (P < 0.01). aP < 0.05 vs NS group, cP < 0.05 vs HO-1/BMMSCs group.
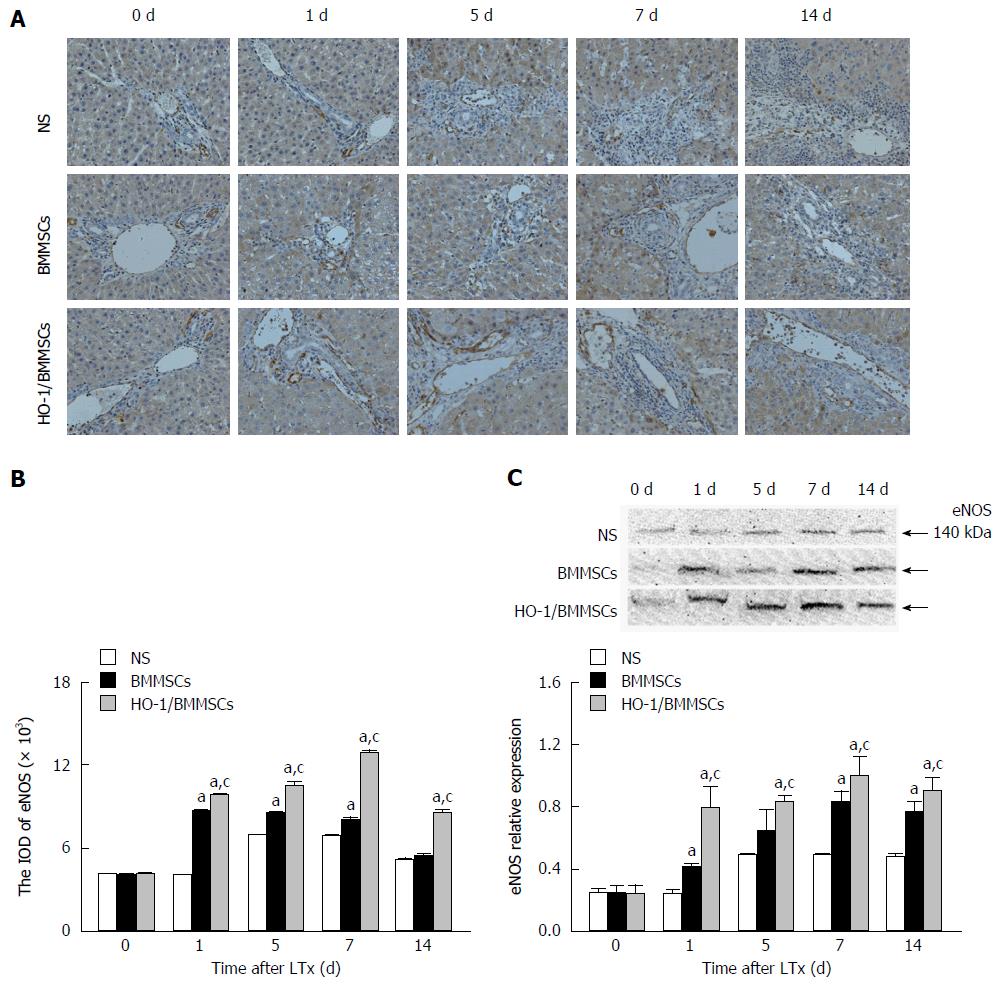
Figure 7 Endothelial nitric-oxide synthase expression in liver after liver transplantation.
A: Immunohistochemistry (IHC) of endothelial nitric-oxide synthase (eNOS); B: IHC integrated optical density (IOD) of eNOS; C: Western blotting and eNOS protein levels. eNOS protein levels: postoperative day (POD) 1: HO-1/BMMSCs group vs BMMSCs group vs NS group: 0.79 ± 0.14 vs 0.42 ± 0.02 vs 0.25 ± 0.02 (P < 0.05). POD5: HO-1/BMMSCs vs NS group: 0.84 ± 0.04 vs 0.50 ± 0.01 (P < 0.01); HO-1/BMMSCs group vs BMMSCs group: 0.84 ± 0.04 vs 0.50 ± 0.01 (P < 0.05). POD7: HO-1/BMMSCs group vs BMMSCs group vs NS group: 1.00 ± 0.12 vs 0.84 ± 0.06 vs 0.50 ± 0.01 (P < 0.05). POD14: HO-1/BMMSCs group vs BMMSCs group vs NS group: 0.90 ± 0.09 vs 0.77 ± 0.07 vs 0.48 ± 0.02 (P < 0.01). aP < 0.05 vs NS group, cP < 0.05 vs HO-1/BMMSCs group.
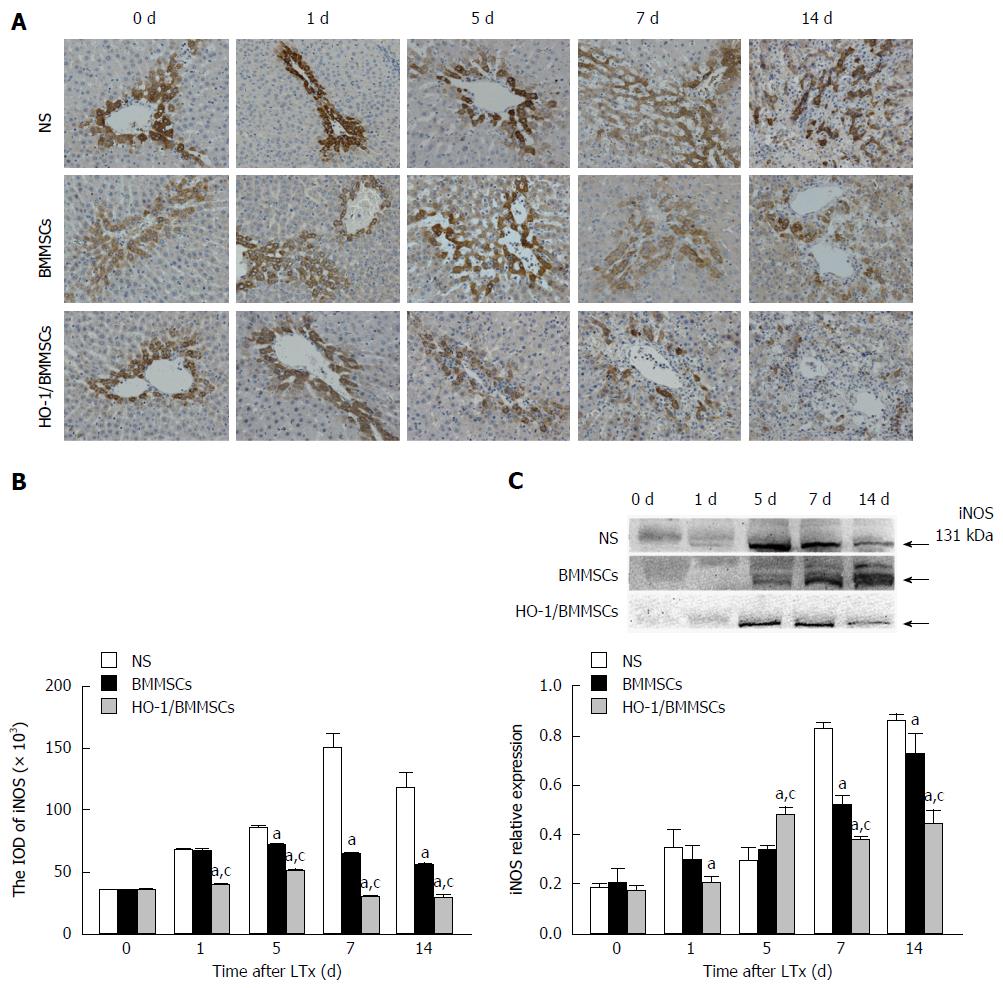
Figure 8 Inducible nitric-oxide synthase expression in the liver after liver transplantation.
A: Immunohistochemistry (IHC) of inducible nitric-oxide synthase (iNOS); B: IHC integrated optical density (IOD) of iNOS; C: iNOS protein levels. iNOS protein levels: postoperative day (POD) 1: HO-1/BMMSCs group vs NS group: 0.21 ± 0.02 vs 0.35 ± 0.07 (P < 0.05). POD5: HO-1/BMMSCs vs NS group: 0.48 ± 0.03 vs 0.30 ± 0.05 (P < 0.01); HO-1/BMMSCs group vs BMMSCs group: 0.48 ± 0.03 vs 0.34 ± 0.02 (P < 0.01). POD7: HO-1/BMMSCs group vs BMMSCs group vs NS group: 0.38 ± 0.01 vs 0.52 ± 0.04 vs 0.83 ± 0.03 (P < 0.01). POD14: HO-1/BMMSCs group vs BMMSCs group vs NS group: 0.45 ± 0.06 vs 0.73 ± 0.08 vs 0.86 ± 0.03 (P < 0.05). aP < 0.05 vs NS group, cP < 0.05 vs HO-1/BMMSCs group.
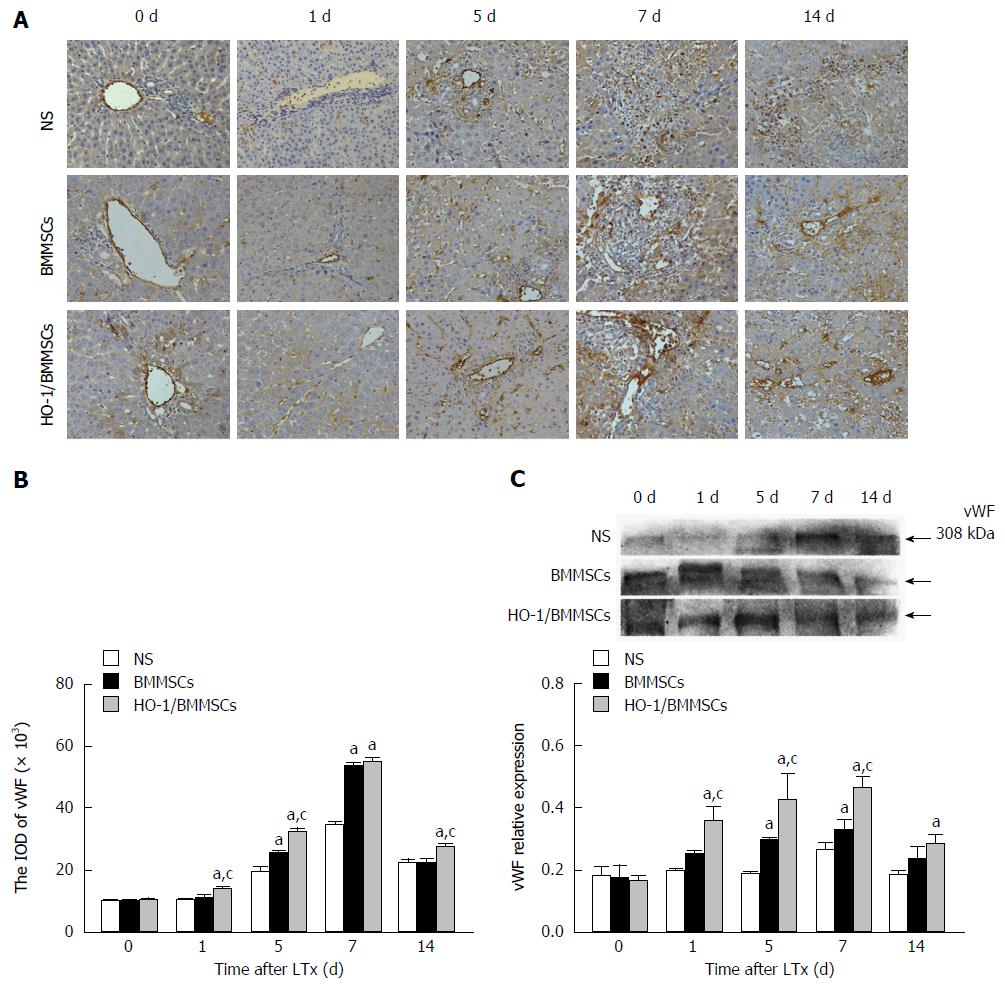
Figure 9 von Willebrand factor expression in the liver after liver transplantation.
A: Immunohistochemistry (IHC) of von willebrand factor (vWF); B: IHC integrated optical density (IOD) of vWF; C: Western blotting and vWF protein levels.vWF protein levels: Postoperative day (POD) 1: HO-1/BMMSCs group vs NS group: 0.36 ± 0.05 vs 0.20 ± 0.00 (P < 0.01); HO-1/BMMSCs group vs BMMSCs group: 0.36 ± 0.05 vs 0.25 ± 0.01 (P < 0.01). POD5: HO-1/BMMSCs vs BMMSCs group vs NS group: 0.43 ± 0.08 vs 0.30 ± 0.01 vs 0.19 ± 0.01 (P < 0.05). POD7: HO-1/BMMSCs group vs BMMSCs group vs NS group: 0.46 ± 0.04 vs 0.33 ± 0.03 vs 0.26 ± 0.03 (P < 0.05). POD14: HO-1/BMMSCs group vs NS group: 0.28 ± 0.03 vs 0.18 ± 0.01 (P < 0.01). aP < 0.05 vs NS group, cP < 0.05 vs HO-1/BMMSCs group.
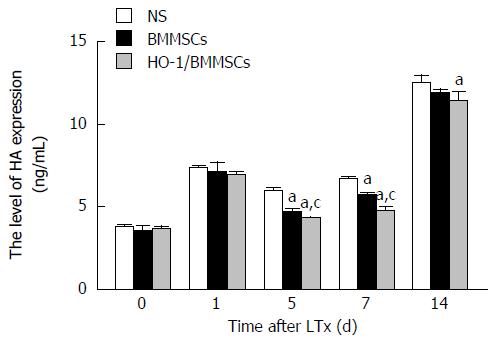
Figure 10 Hyaluronic acid expression in serum after liver transplantation.
The serum hyaluronic acid (HA) level tended to increase initially, then decrease, and later increase again with the extension of post-operative time. Serum HA in the HO-1/BMMSCs group was lower than that of the BMMSCs and NS groups on postoperative day (POD) 5: HO-1/BMMSCs vs BMMSCs group vs NS group: 4.31 ± 0.07 vs 4.66 ± 0.24 vs 5.99 ± 0.15 (P < 0.01). POD7: HO-1/BMMSCs group vs BMMSCs group vs NS group: 4.78 ± 0.23 vs 5.73 ± 0.11 vs 6.72 ± 0.14 (P < 0.01). POD14: HO-1/BMMSCs group vs NS group: 11.43 ± 0.52 vs 12.52 ± 0.51 (P < 0.01). aP < 0.05 vs NS group, cP < 0.05 vs HO-1/BMMSCs group.
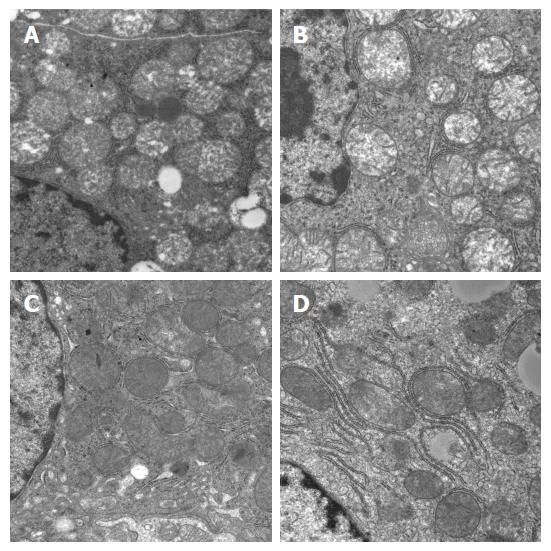
Figure 11 Mitochondrial ultrastructure changes on the 7th d after liver transplantation.
A: Postoperative day (POD) 0; B: Normal saline (NS) group on POD7; C: Bone marrow-derived mesenchymal stem cells (BMMSCs) group on POD7; D: HO-1/BMMSCs group on POD7 (× 25000). The mitochondrial damage to hepatocytes was relatively severe in the NS group, with obvious swelling and vacuolized mitochondria and disturbed structures of mitochondrial cristae (some even disappeared). Mitochondria in the HO-1/BMMSCs and BMMSCs groups showed mild swelling, no vacuolization, and the integrated structures of the mitochondrial ridge were present.
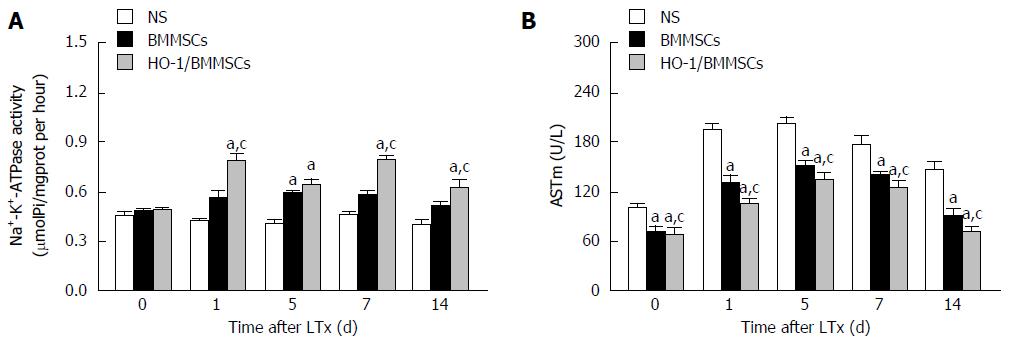
Figure 12 Liver Na+-K+-ATPase activity and mitochondrial aspartate aminotransferase level after liver transplantation.
A: Na+-K+-ATPase activity; B: Serum mitochondrial aspartate aminotransferase (ASTm). Na+-K+-ATPase activity (μmoLPi/mgprot per hour): The degradation of ATP per mg of protein per hour produces 1 μmol of inorganic phosphorus was defined as one unit of ATPase activity. The activities of ATPase in the HO-1/BMMSCs group were higher than those of the BMMSCs and NS groups. Postoperative day (POD) 1: HO-1/BMMSCs group vs NS group: 0.79 ± 0.04 vs 0.42 ± 0.02 (P < 0.01); HO-1/BMMSCs group vs BMMSCs group: 0.79 ± 0.04 vs 0.57 ± 0.04 (P < 0.01). POD5: BMMSCs vs NS group: 0.59 ± 0.01 vs 0.40 ± 0.03 (P < 0.05); HO-1/BMMSCs vs NS group: 0.64 ± 0.04 vs 0.40 ± 0.03 (P < 0.01). POD7: HO-1/BMMSCs group vs NS group: 0.79 ± 0.03 vs 0.46 ± 0.02 (P < 0.01); HO-1/BMMSCs group vs BMMSCs group: 0.79 ± 0.03 vs 0.58 ± 0.03 (P < 0.01). POD14: HO-1/BMMSCs group vs NS group: 0.63 ± 0.05 vs 0.40 ± 0.03 (P < 0.01); HO-1/BMMSCs group vs BMMSCs group: 0.63 ± 0.05 vs 0.52 ± 0.03 (P < 0.05). ASTm showed a tendency to increase initially and then decrease with the extension of post-operative time. The expression of ASTm was the lowest in the HO-1/BMMSCs group and highest in the NS group on POD0, 1, 5, 7 and 14 (P < 0.05). aP < 0.05 vs NS group, cP < 0.05 vs HO-1/BMMSCs group.
- Citation: Yang L, Shen ZY, Wang RR, Yin ML, Zheng WP, Wu B, Liu T, Song HL. Effects of heme oxygenase-1-modified bone marrow mesenchymal stem cells on microcirculation and energy metabolism following liver transplantation. World J Gastroenterol 2017; 23(19): 3449-3467
- URL: https://www.wjgnet.com/1007-9327/full/v23/i19/3449.htm
- DOI: https://dx.doi.org/10.3748/wjg.v23.i19.3449


