Copyright
©The Author(s) 2017.
World J Gastroenterol. May 7, 2017; 23(17): 3092-3098
Published online May 7, 2017. doi: 10.3748/wjg.v23.i17.3092
Published online May 7, 2017. doi: 10.3748/wjg.v23.i17.3092
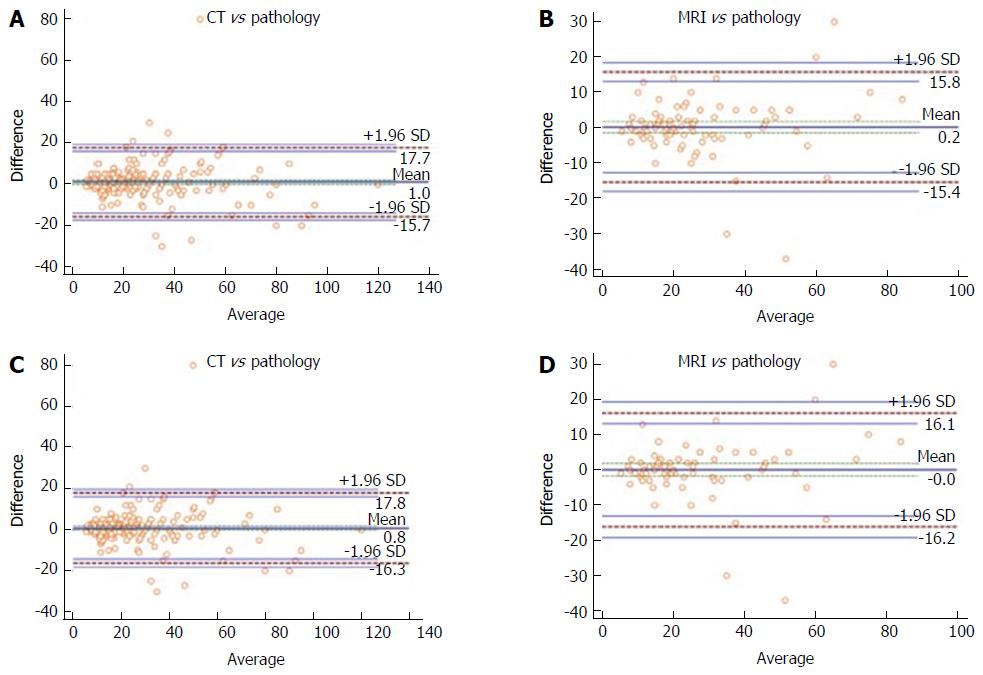
Figure 1 Bland-Altman analysis.
A and B show the analysis for CT and MR performed on overall population; C and D represent the method applied only on NF-PanNET. PanNET: Pancreatic neuroendocrine tumors; MR: Magnetic resonance; CT: Computer tomography.
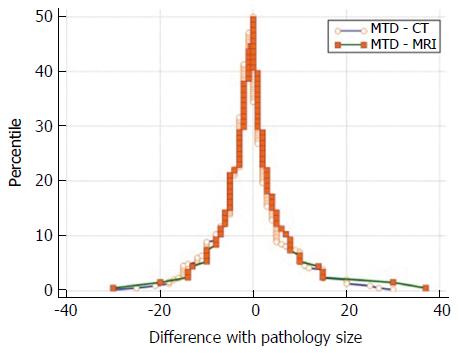
Figure 2 Mountain-plot.
The two methods are unbiased with respect to each other (overall population). MTD: Maximum tumor diameter.
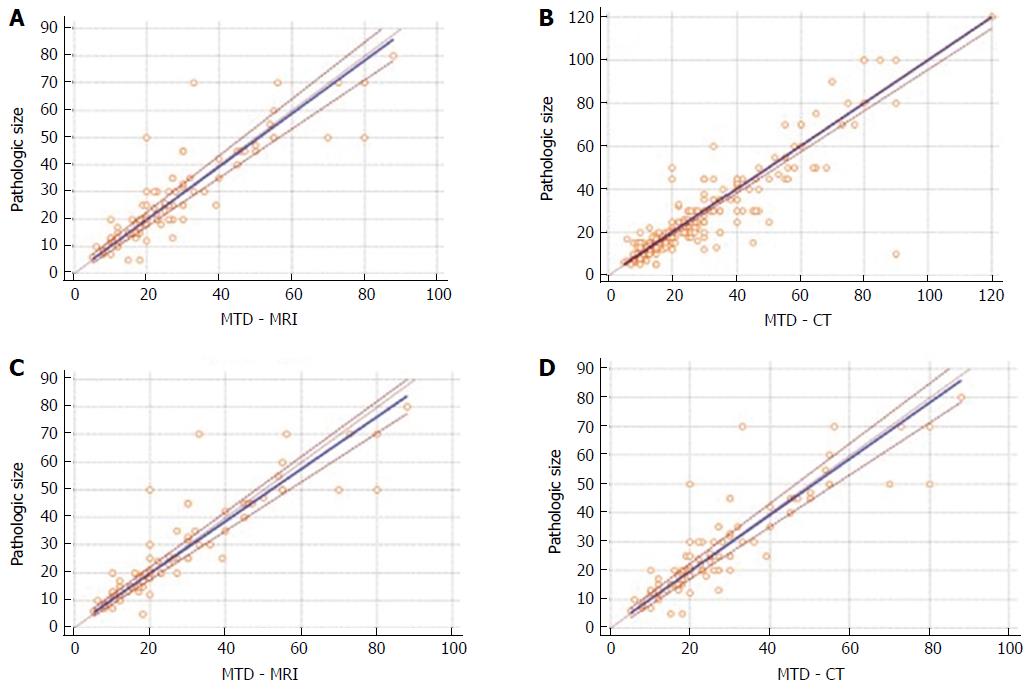
Figure 3 Passing-Bablok regression analysis.
See text for further information. MTD: Maximum tumor diameter; PanNET: Pancreatic neuroendocrine tumors; MR: Magnetic resonance; CT: Computer tomography.
- Citation: Paiella S, Impellizzeri H, Zanolin E, Marchegiani G, Miotto M, Malpaga A, De Robertis R, D'Onofrio M, Rusev B, Capelli P, Cingarlini S, Butturini G, Davì MV, Amodio A, Bassi C, Scarpa A, Salvia R, Landoni L. Comparison of imaging-based and pathological dimensions in pancreatic neuroendocrine tumors. World J Gastroenterol 2017; 23(17): 3092-3098
- URL: https://www.wjgnet.com/1007-9327/full/v23/i17/3092.htm
- DOI: https://dx.doi.org/10.3748/wjg.v23.i17.3092


