Copyright
©The Author(s) 2017.
World J Gastroenterol. Apr 28, 2017; 23(16): 2987-2994
Published online Apr 28, 2017. doi: 10.3748/wjg.v23.i16.2987
Published online Apr 28, 2017. doi: 10.3748/wjg.v23.i16.2987
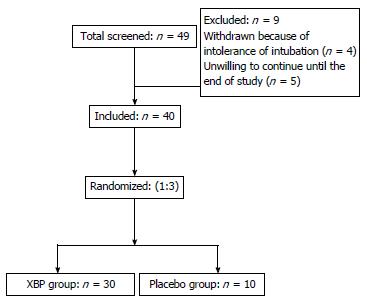
Figure 1 Flow diagram of patient selection.
XBP: Xiangbin prescription.
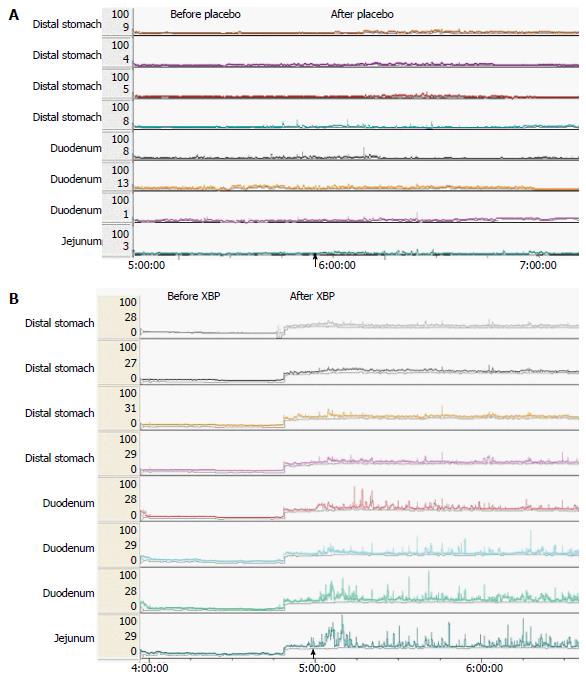
Figure 2 Gastrointestinal motility tracings before and after placebo or XBP treatment.
A: Representative pressure curves after administration of placebo; B: Representative pressure curves after administration of XBP. XBP: Xiangbin prescription.
- Citation: Jiang Z, Cao LX, Liu B, Chen QC, Shang WF, Zhou L, Li DY, Guo DA, Chen ZQ. Effects of Chinese herbal medicine Xiangbin prescription on gastrointestinal motility. World J Gastroenterol 2017; 23(16): 2987-2994
- URL: https://www.wjgnet.com/1007-9327/full/v23/i16/2987.htm
- DOI: https://dx.doi.org/10.3748/wjg.v23.i16.2987


