Copyright
©The Author(s) 2017.
World J Gastroenterol. Apr 28, 2017; 23(16): 2940-2947
Published online Apr 28, 2017. doi: 10.3748/wjg.v23.i16.2940
Published online Apr 28, 2017. doi: 10.3748/wjg.v23.i16.2940
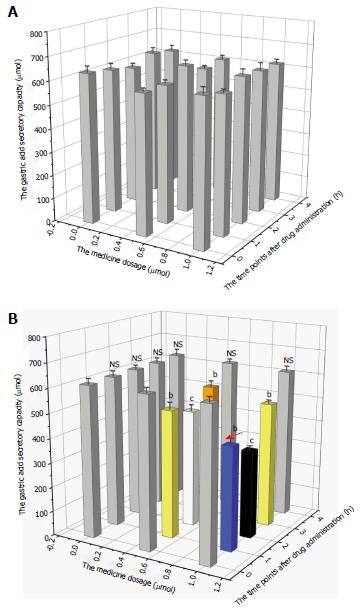
Figure 1 Changes in gastric acid secretion in rats.
A: Intracerebroventricular injection; B: Intravenous injection. Rats were randomly assigned into 30 groups based on drug dosage and representative time points after administration. In each group, 15 rats were intracerebroventricularly injected with the drug, while the remaining 15 rats were intravenously injected with the drug. X axis: drug dosage; Y axis: time points after drug administration; Z axis: gastric acid secretory capacity, which was presented as the height of the histogram with its corresponding color (capacity: black < white < yellow < orange < gray). As shown in Figure 1B, the gastric acid secretion level of rats in the 1.0 μg/5 μL nesfatin-1 group reached 358.85 μmoL two hours after intravenous injection. This level was much lower than that in rats at zero-hour after intravenous injection (618.27 μmoL). The difference was statistically significant (P = 0.000). cP < 0.001, bP < 0.05; NS: No significant difference.
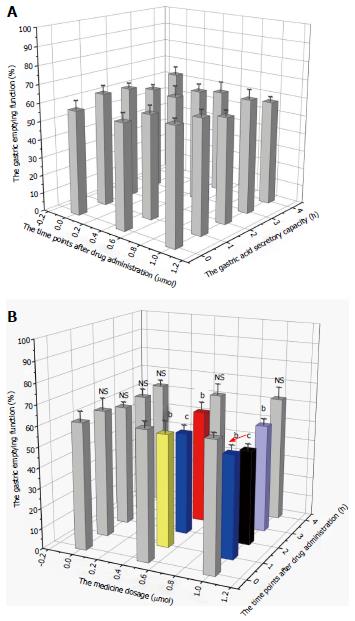
Figure 2 Changes in gastric emptying function in rats.
A: intracerebroventricular infusion; B: intravenous injection. Rats were randomly assigned into 30 groups based on drug dosage and representative time points after administration. In each group, every 15 rats were intracerebroventricularly injected, while 15 rats were intravenously injected. X axis: drug dosage; Y axis: time points after drug administration; Z axis: gastric emptying function, which was presented as the height of the histogram with its corresponding color (capacity: black < blue < light blue < yellow < red < gray). As shown in Figure 2B, the gastric emptying rate of rats in the 1.0 μg/5 μL nesfatin-1 group reached 46.69% two hours after intravenous injection. This was much lower than in rats at zero-hour after intravenous injection (62.84%). The difference was statistically significant (P = 0.024). The differences were not statistically significant, cP < 0.001, bP < 0.05; NS: No significant difference.
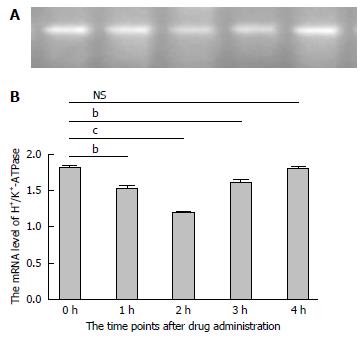
Figure 3 mRNA expression of H+/K+-ATPase.
A: A typical RT-PCR result; B: The mRNA expression of H+/K+-ATPase in different groups. cP < 0.001, bP < 0.05; NS: No significant difference.
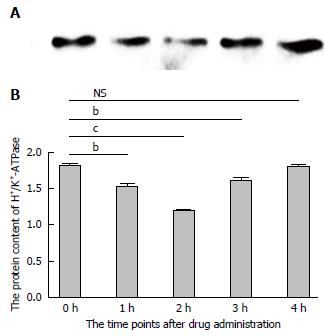
Figure 4 Protein expression of H+/K+-ATPase.
A: A typical of western-blot result; B: The protein expression of H+/K+-ATPase in different groups. cP < 0.001, bP < 0.05; NS: No significant difference.
- Citation: Yang GT, Zhao HY, Kong Y, Sun NN, Dong AQ. Study of the effects of nesfatin-1 on gastric function in obese rats. World J Gastroenterol 2017; 23(16): 2940-2947
- URL: https://www.wjgnet.com/1007-9327/full/v23/i16/2940.htm
- DOI: https://dx.doi.org/10.3748/wjg.v23.i16.2940


