Copyright
©The Author(s) 2017.
World J Gastroenterol. Apr 28, 2017; 23(16): 2891-2898
Published online Apr 28, 2017. doi: 10.3748/wjg.v23.i16.2891
Published online Apr 28, 2017. doi: 10.3748/wjg.v23.i16.2891
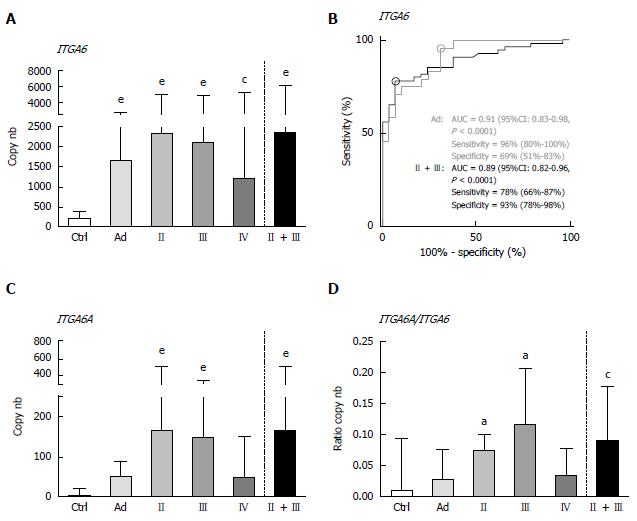
Figure 1 Detection of ITGA6 and ITGA6A in stool samples of controls and patients diagnosed with Ad and stage II-IV CRC by duplex ddPCR.
A: For total ITGA6, significant increases in copy number were observed for Ad and all tested CRC stages relative to the controls (Ctrl); B: ROC curve analysis of ITGA6 detection in Ad and in stages II-III CRC. Area under the curve (AUC), sensitivity and specificity are provided (95%CI); C: For ITGA6A, significant increases in copy number were only observed for stage II and stage III CRC relative to Ctrl; D: Accordingly, ITGA6A/ITGA6 ratios were found to be significantly different between controls and stage II and III CRC. Results in A, C and D are expressed as median (interquartile range) of copy number relative to control patients. aP < 0.05, cP < 0.01, eP < 0.001 using the Kruskal-Wallis test followed by Dunn’s multiple comparison test.
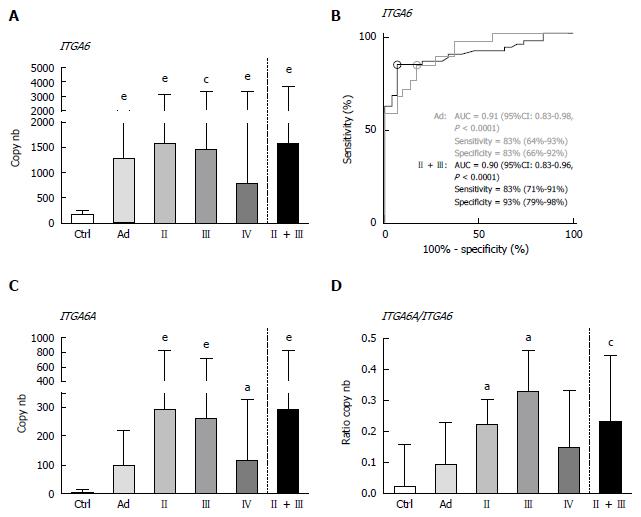
Figure 2 Detection of ITGA6 and ITGA6A in stool samples of controls and patients diagnosed with Ad and stage II-IV CRC by duplex qPCR.
A: For total ITGA6, significant increases in copy number were observed for Ad and all tested CRC stages relative to Ctrl; B: ROC curve analysis of ITGA6 detection in Ad and in stages II-III CRC. AUC, sensitivity and specificity are provided (95%CI); C: For ITGA6A, significant increases in copy number were only observed for stage II and stage III CRC relative to Ctrl; D: Accordingly, ITGA6A/ITGA6 ratios were found to be significantly different between controls and stage II and III CRC. Results in A, C and D are expressed as median (interquartile range) of copy number relative to control patients. aP < 0.05, cP < 0.01, eP < 0.001 using the Kruskal-Wallis test followed by Dunn’s multiple comparison test.
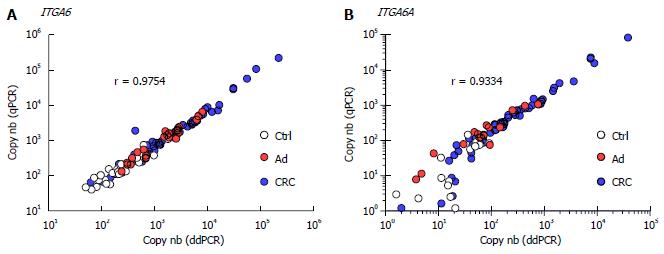
Figure 3 Correlation between ddPCR and qPCR measurements.
ITGA6 (A) and ITGA6A (B) levels (copy number) detected in controls (Ctrl: white), Ad (red) and CRC (blue) were plotted and evaluated using the nonparametric Spearman correlation test.
- Citation: Herring E, Kanaoka S, Tremblay É, Beaulieu JF. Droplet digital PCR for quantification of ITGA6 in a stool mRNA assay for the detection of colorectal cancers. World J Gastroenterol 2017; 23(16): 2891-2898
- URL: https://www.wjgnet.com/1007-9327/full/v23/i16/2891.htm
- DOI: https://dx.doi.org/10.3748/wjg.v23.i16.2891


