Copyright
©The Author(s) 2017.
World J Gastroenterol. Apr 21, 2017; 23(15): 2785-2794
Published online Apr 21, 2017. doi: 10.3748/wjg.v23.i15.2785
Published online Apr 21, 2017. doi: 10.3748/wjg.v23.i15.2785
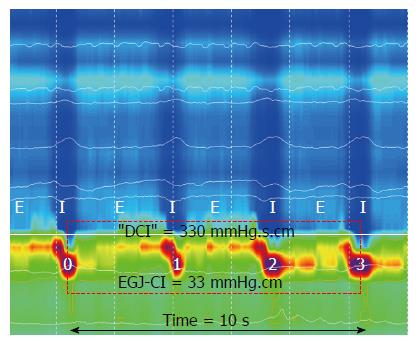
Figure 1 Method for determining esophagogastric junction contractile integral.
Inspiration (I) and expiration (E) are pictured for the intra thoracic portion above the EGJ (respiratory inversion pictured as dotted white line). Isobaric contour tool is adjusted to 2 mmHg above the intra gastric pressure to determine the boundaries for the EGJ. The “DCI box” (dotted red) is placed around the EGJ starting at the diaphragmatic contraction (mid-point inspiration) and extended for 3 further respiratory cycles. The “DCI”-value is then divided by time to determine EGJ-CI in mmHg.cm. EGJ: Esophagogastric junction.
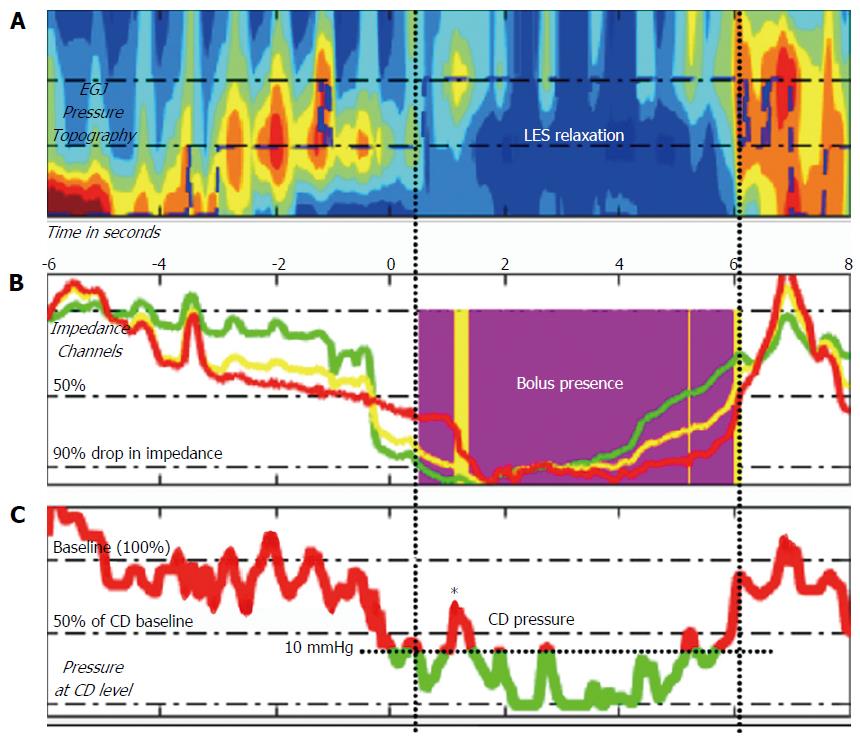
Figure 2 Method for determining bolus flow time at the esophagogastric junction using pressure impedance data (modified from Lin 2014).
A: Esophageal pressure topography of region of interest at EGJ; B: Bolus flow is determined as occurring at the EGJ when the distal esophageal impedance drops below 90% of baseline until impedance returns above 50% baseline (purple area), provided pressure criteria are simultaneously met at the crural diaphragm (CD) position; C: Pressure above 10 mmHg and 50% peak pressure inhibits bolus flow at CD position despite impedance criteria being met (* - corresponding with yellow area in B).
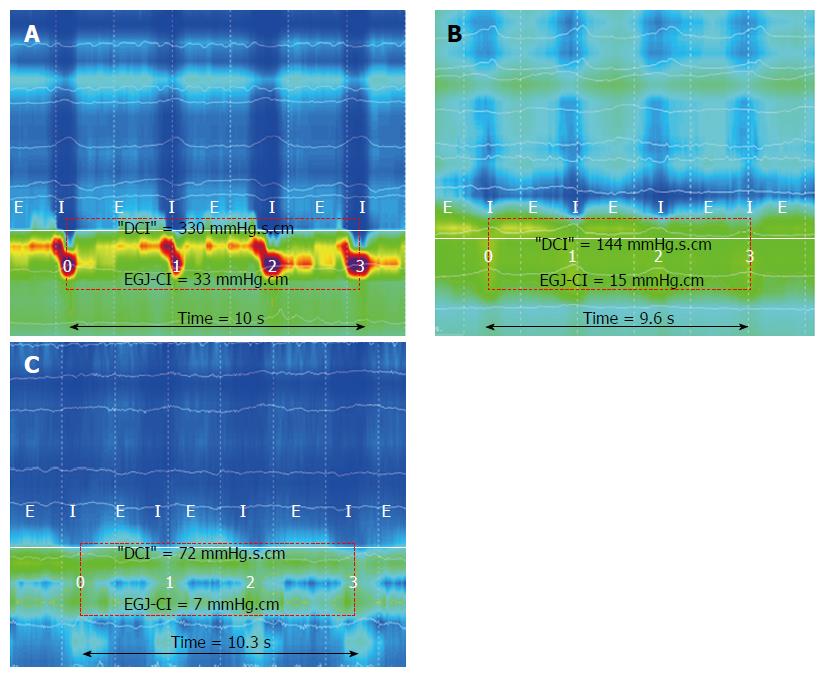
Figure 3 Examples of esophagogastric junction-contractile integral in 3 individuals; an (A) 85-year-old, (B) 50-year-old and (C) 22-year-old.
In addition to different EGJ-CI measurements, three different EGJ subtypes are displayed as subtypes I (A), II (B) and IIIb (C). Expiration (E) and inspiration (I) are pictured overlaying the thoracic recording, while pressure inversion is indicated by a solid white line.
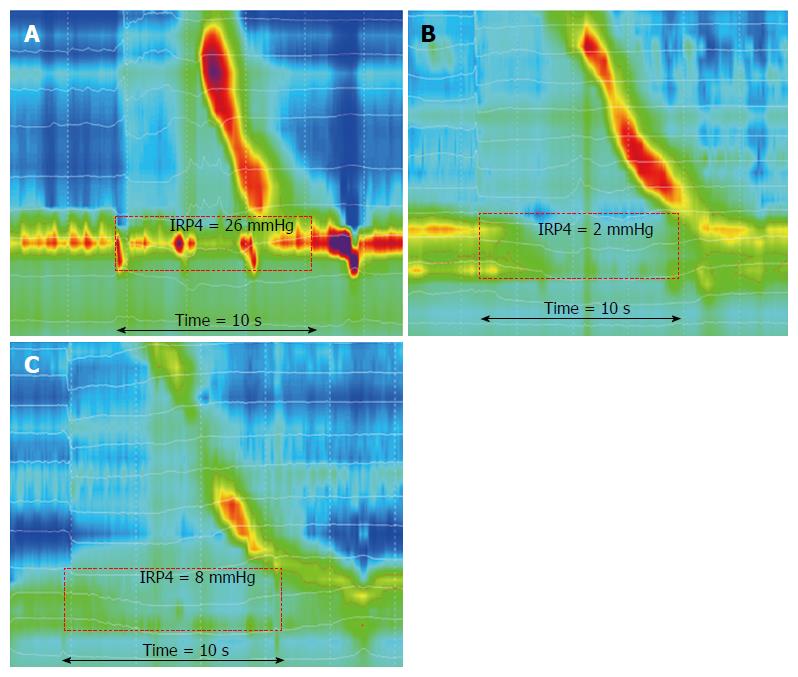
Figure 4 Examples of 4 second integrated relaxation pressure in the same subjects in Figure 3; an (A) 85-year-old, (B) 50-year-old and (C) 22-year-old.
EGJ non- relaxation, despite adequate peristaltic response is seen in 4A, while normal relaxation responses are seen in association with peristalsis (4B) or fragmented peristalsis (4C).
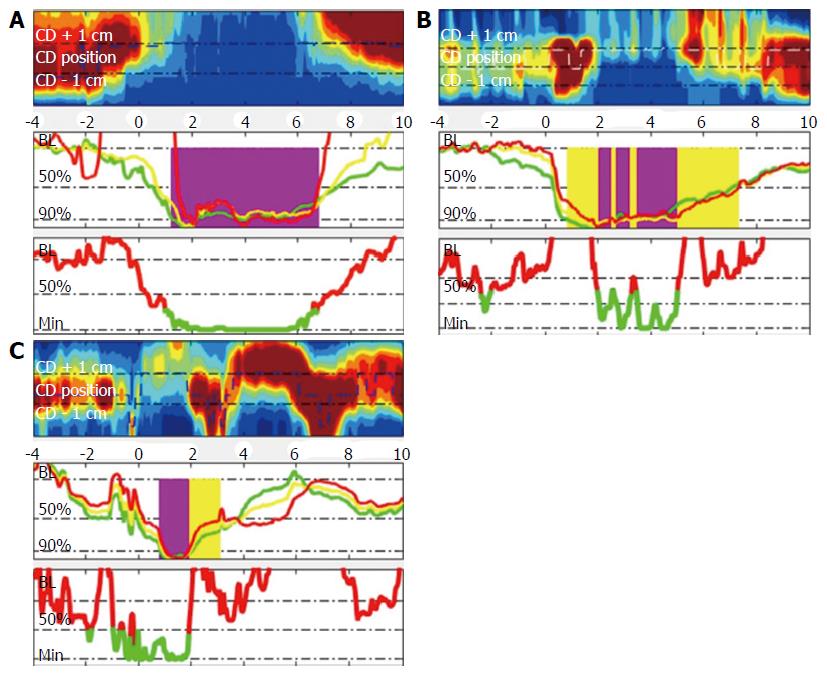
Figure 5 Examples of bolus flow time calculation.
Both flow and pressure criteria need to be satisfied for bolus flow (purple) (5A). If only the impedance criteria are met, but flow is interrupted by an increase in pressure due to vascular (5B) or crural contraction (5C), no flow is measured (yellow).
Figure 6 Bolus flow time is reduced during liquid and viscous swallows in asymptomatic older subjects without (older non-cleared) impedance-based esophageal bolus clearance and also in older subjects with esophageal clearance (older cleared) by impedance criteria, when compared to young controls (control).
aP < 0.05, eP < 0.001 vs control; fP < 0.001 vs older cleared. BFT: Bolus flow time.
Figure 7 Bolus flow time vs bolus presence time in older subjects with (filled diamonds) and without (open diamonds) bolus clearance and controls (filled circles) during liquid (7A) and viscous (7B) swallows.
All older subjects with failed bolus clearance had a reduced BFT (5th percentile control BFT and BPT shown in red). BFT/BPT matrix can be used to differentiate individuals with failed clearance into those with equivalent reduced BPT (a), indicative of ineffective esophageal motility, and those with increased BPT (b), indicative of bolus retention above the esophagogastric junction due to increased flow resistance. BFT: Bolus flow time; BPT: Bolus presence time.
- Citation: Cock C, Besanko LK, Burgstad CM, Thompson A, Kritas S, Heddle R, Fraser RJ, Omari TI. Age-related impairment of esophagogastric junction relaxation and bolus flow time. World J Gastroenterol 2017; 23(15): 2785-2794
- URL: https://www.wjgnet.com/1007-9327/full/v23/i15/2785.htm
- DOI: https://dx.doi.org/10.3748/wjg.v23.i15.2785


