Copyright
©The Author(s) 2017.
World J Gastroenterol. Apr 21, 2017; 23(15): 2673-2684
Published online Apr 21, 2017. doi: 10.3748/wjg.v23.i15.2673
Published online Apr 21, 2017. doi: 10.3748/wjg.v23.i15.2673
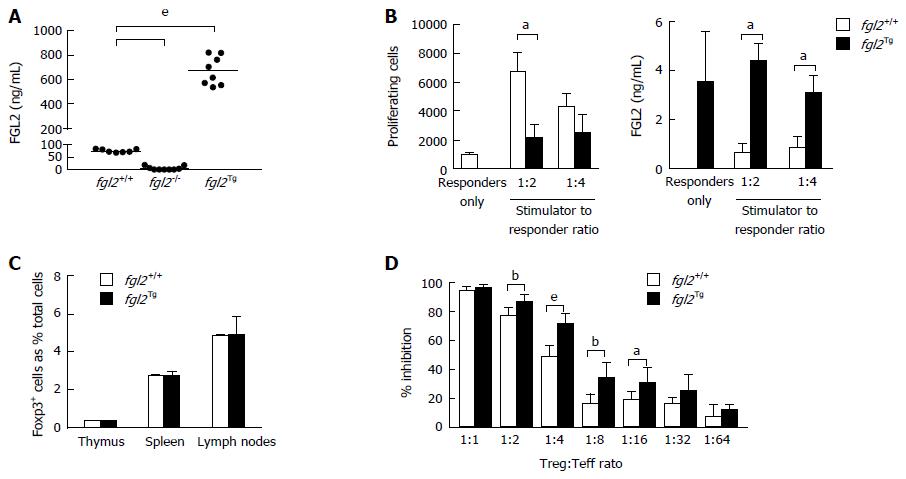
Figure 1 Immunologic characterization of fgl2Tg mice.
A: Fibrinogen-like protein 2 (FGL2) plasma levels. Bar represents mean levels (n = 7-8 mice/group); B: One-way MLR and FGL2 levels in MLR culture supernatants. FGL2 overexpression inhibits T cell proliferation in response to stimulation with BALB/c alloantigens. Proliferation was measured by flow cytometry. FGL2 levels in MLR culture supernatant were measured by an FGL2 ELISA. Data represent the mean ± SD and are representative of three independent experiments; C: Foxp3+ cell percentages in the thymus, spleen and lymph nodes. Foxp3+ cells are represented as a percentage of total SMNC. Data are expressed as the mean ± SD (n = 3 mice/group); D: Treg suppression assay. The suppressive activity of Treg is expressed as a percent inhibition of T cell proliferation compared to responder T cells alone. Graphs show the mean ± SD. Data are representative of 3 independent experiments. (aP < 0.05, bP < 0.01, eP < 0.001). MLR: Mixed lymphocyte reaction; SMNC: Splenic mononuclear cells; Treg: Regulatory T cell.
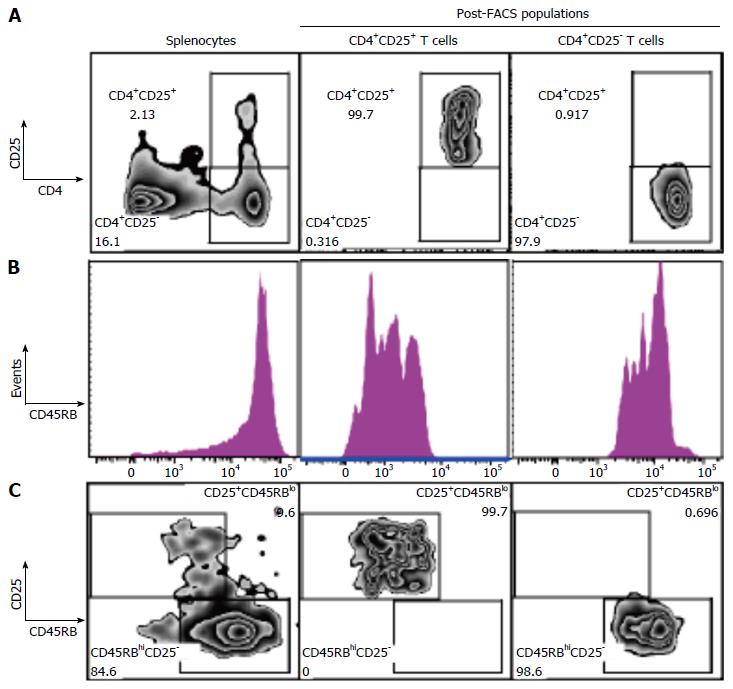
Figure 2 Isolation of CD4+CD25+CD45RBlow Treg and CD4+CD25-CD45RBhigh Teff.
A: Representative flow plots of CD4 vs CD25 populations. SMNC were isolated and enriched for CD4+ T cells by negative T cell selection using magnetic cell sorting. CD4+ T cells fractions were stained with CD4+-PE-Cy7, CD25+-PE and CD45RB-APC and sorted into CD4+CD25+CD45RBlow and CD4+CD25-CD45RBhigh T cell fractions. Cells were gated on live cells, singlets and CD4+ populations. Plots show initial SMNC population and the CD4+CD25+ and CD4+CD25- T cell populations following FACS sorting; B: Histogram of CD45RB cell distribution; C: Flow plots of CD25 vs CD45RB populations. Final populations of CD4+CD25+CD45RBlow and CD4+CD25-CD45RBhigh T cell fractions were > 98% pure. SMNC: Splenic mononuclear cells; Teff: Effector T cell; Treg: Regulatory T cell.
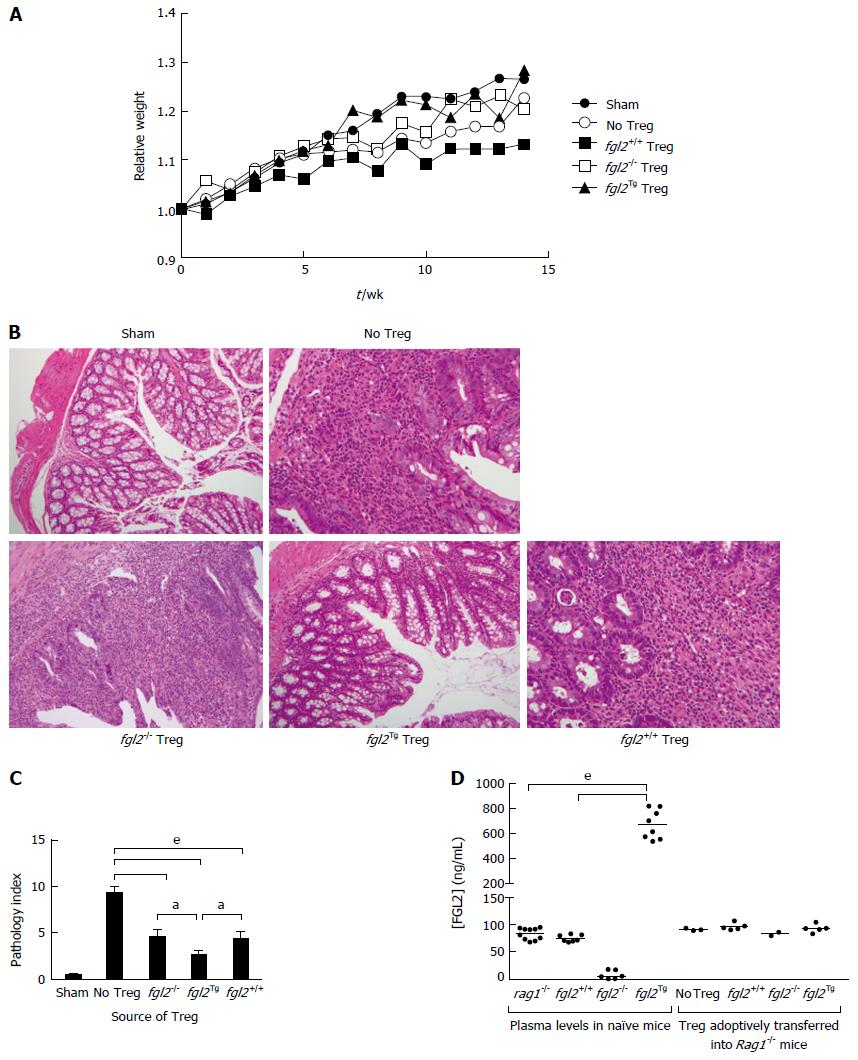
Figure 3 fgl2Tg Treg protect against colitis.
A: Effect of Treg on clinical course of disease as determined by weight. Mice were weighed weekly and were sacrificed at 14 wk post cell transfer. Mice that received fgl2Tg Treg gained weight similar to the sham group of mice, whereas all other groups had reduced weight gain (n ≥ 5 mice/group); B: Histology of colons. Sham colons had normal villous architecture with abundant goblet cells. Colons from the no Treg group showed prominent features of severe colitis with dense cellular infiltration, edema, and abscess formation as well as loss of goblet cells. Infusion of fgl2-/- or fgl2+/+ Treg led to overall improved histology; however, numerous areas of patchy colonic disease were still seen. In contrast, colons from mice that received fgl2Tg Treg were near normal. H&E; Original magnification 100 ×; C: Pathologic scoring of colon sections. Scoring was performed on H&E stained sections as described in the methods section. Data represent mean ± SEM. Pathology scores were obtained from 2 independent experiments with n ≥ 5 mice per group; D: Transfer of fgl2Tg Treg does not alter FGL2 plasma levels during colitis. Blood from fgl2+/+, Rag1-/- and, fgl2Tg mice was collected prior to the induction of colitis (plasma levels in naïve mice). At sacrifice, blood was collected from each animal. Rag1-/- mice received CD4+CD25-CD45RBhi T cells and Treg isolated from fgl2+/+ or fgl2Tg mice (Treg adoptively transferred into Rag1-/- mice). Plasma levels of FGL2 were measured using an FGL2 ELISA. Statistical analysis was performed using a one-way ANOVA and Tukey’s multiple comparison post-hoc test (aP < 0.05, eP < 0.001). Treg: Regulatory T cells.
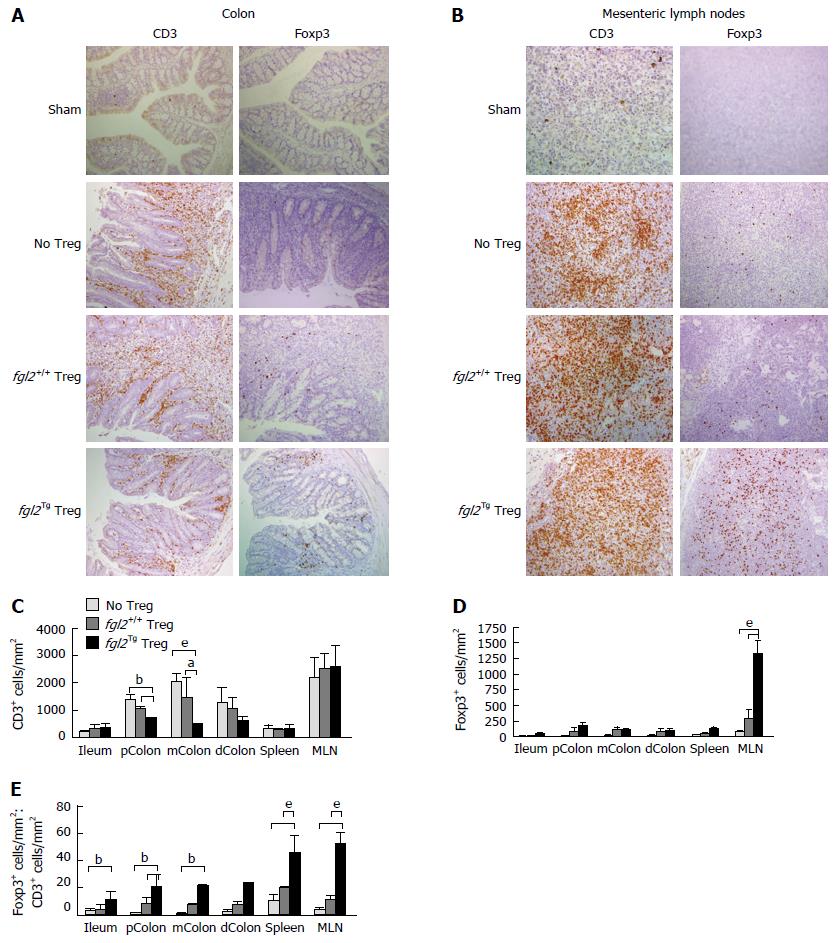
Figure 4 Foxp3+ Treg are increased and CD3+ T cells are decreased in mice that received fgl2Tg Treg.
A: Representative photomicrographs of CD3 and Foxp3 staining of colonic sections. Sham colons were negative for both CD3 and Foxp3. Mice that received Teff and no Treg or fgl2+/+ Treg had large numbers of CD3+ T cells in the lamina propria and epithelium, whereas colons from mice that received fgl2Tg Treg had only patchy CD3+ T cell infiltrates. Original magnification × 100; B: Representative photomicrographs of CD3 and Foxp3 staining of MLN sections. MLN from sham mice had very few CD3+ cells. In contrast, large numbers of CD3+ T cells were seen in the MLN of the other groups of mice. Treg staining was absent in the MLN of sham mice and very few Foxp3+ cells were seen in mice that only received Teff or mice that received fgl2+/+ Treg, whereas large numbers of Foxp3+ cells were seen in mice that received fgl2Tg Treg. Original magnification × 100; C: Absolute numbers of CD3+ cells by morphometry (cells/mm2); D: Absolute numbers of Foxp3+ T cells by morphometry (cells/mm2); E: Ratio of Foxp3+ to CD3+ T cells in each tissue section. Data represent the mean ± SD. Quantification is based on two independent experiments with n ≥ 5 mice per group (aP < 0.05, bP < 0.01, eP < 0.001). MLN: Mesenteric lymph nodes; Teff: Effector T cells; Treg: Regulatory T cells.
Figure 5 Fgl2Tg Treg prevent proliferation of infiltrating T cells in the colon.
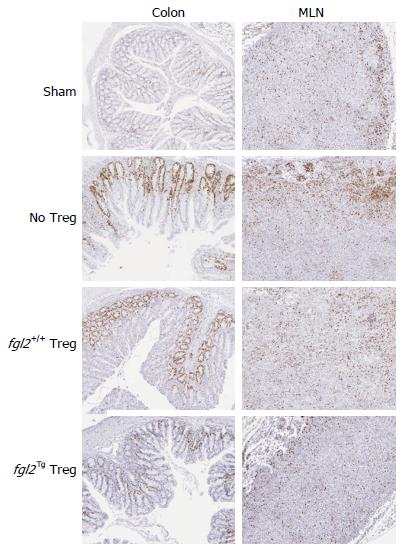
CD3+ T cell proliferation in the MLN and colon were examined by Ki67 staining at week 14. Ki67+ cells were seen primarily in the cortex of the MLN of sham mice. Mice that received Teff had increased clusters of Ki67+ cells, primarily within the cortex. Mice that received fgl2+/+ Treg also had significant numbers of Ki67+ cells, whereas mice that received fgl2Tg Treg had similar numbers of Ki67+ cells as sham mice. Ki67+ cells were only seen in the colonic crypts of sham mice. Mice that were reconstituted with Teff alone had large numbers of Ki67+ cells both within the lamina propria and epithelium, coincident with areas of colonic inflammation. Mice that received fgl2+/+ Treg had small foci of Ki67+ cells in the lamina propria and epithelium whereas no Ki67+ staining was seen in these areas in mice that received fgl2Tg Treg. In all groups of mice colonic crypt cells stained positively for Ki67 as expected. Original magnification × 100. MLN: Mesenteric lymph nodes; Teff: Effector T cells; Treg: Regulatory T cells.
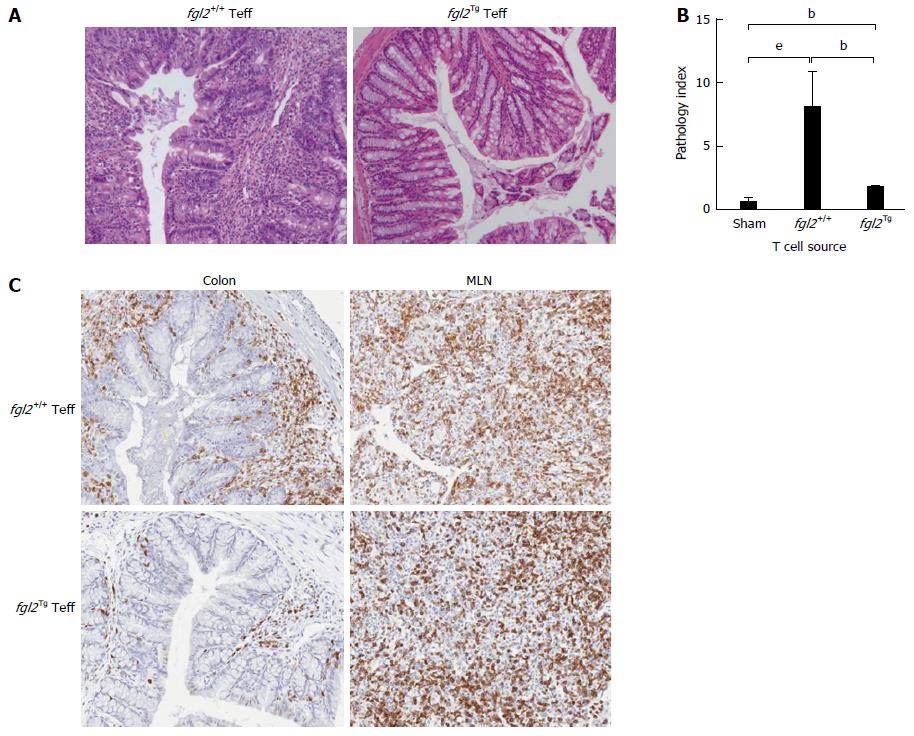
Figure 6 fgl2Tg Teff do not induce colitis.
A: Histopathology. Rag1-/- mice that received fgl2+/+ Teff had histologic evidence of severe colitis with dense CD3+ T cell infiltrates, edema, crypt and goblet cell loss and abscess formation. Colons from mice that received fgl2Tg Teff were near normal. H&E; Original magnification × 100; B: Extent of disease in the colon was confirmed by pathologic scoring. Three sections of the colon were scored as described in the methods. Data are the mean ± SD; C: Immunohistochemistry of CD3+ staining in the colon (left column) or MLN (right column) showing repopulation of MLN in mice that received either fgl2Tg or fgl2+/+ Teff. Dense infiltrates of CD3+ cells were only seen in the colons of mice that received fgl2+/+ Teff and not fgl2Tg Teff. Original magnification × 100. Data represent n = 3 mice per group (bP < 0.01, eP < 0.001). MLN: Mesenteric lymph nodes; Teff: Effector T cells.
- Citation: Bartczak A, Zhang J, Adeyi O, Amir A, Grant D, Gorczynski R, Selzner N, Chruscinski A, Levy GA. Overexpression of fibrinogen-like protein 2 protects against T cell-induced colitis. World J Gastroenterol 2017; 23(15): 2673-2684
- URL: https://www.wjgnet.com/1007-9327/full/v23/i15/2673.htm
- DOI: https://dx.doi.org/10.3748/wjg.v23.i15.2673


