Copyright
©The Author(s) 2017.
World J Gastroenterol. Mar 21, 2017; 23(11): 1980-1989
Published online Mar 21, 2017. doi: 10.3748/wjg.v23.i11.1980
Published online Mar 21, 2017. doi: 10.3748/wjg.v23.i11.1980
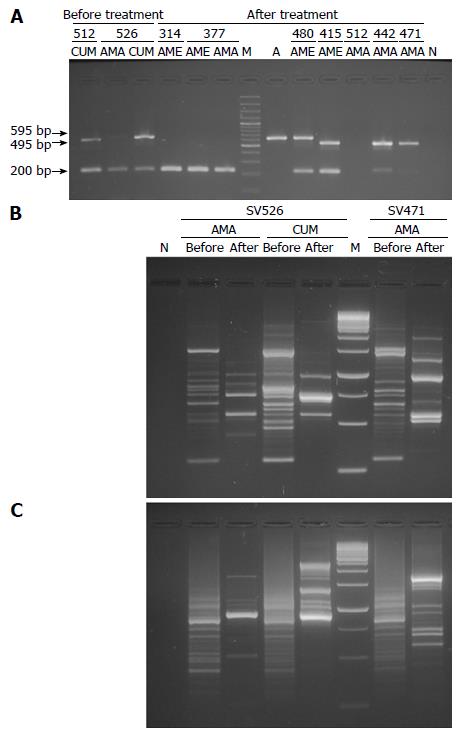
Figure 1 Electrophorectic analyses.
A: EPIYA-PCR products from DNA of H. pylori isolates obtained before (first endoscopy) and after (second endoscopy) treatment in patients with treatment failure, the PCR products were analyzed in agarose gel at 2%. Line A positive control, clinical isolate of H. pylori (PZ5085) with EPIYA motif ABCC (570 ± 25 bp) confirmed through sequencing; line M, 100-bp weight marker; line N, negative reaction control. The distribution of the different molecular weights among isolates is an indication of the presence of multiple EPIYA repetitions; B and C: RAPD patterns generated with primer 1281 and 1254, respectively, in H. pylori isolates obtained before and after anti-H. pylori treatment; line N: Negative reaction control; line M: 100-bp weight marker. ALC: Antrum lesser curvature; AGC: Antrum greater curvature; BGC: Body greater curvature; H. pylori: Helicobacter pylori.
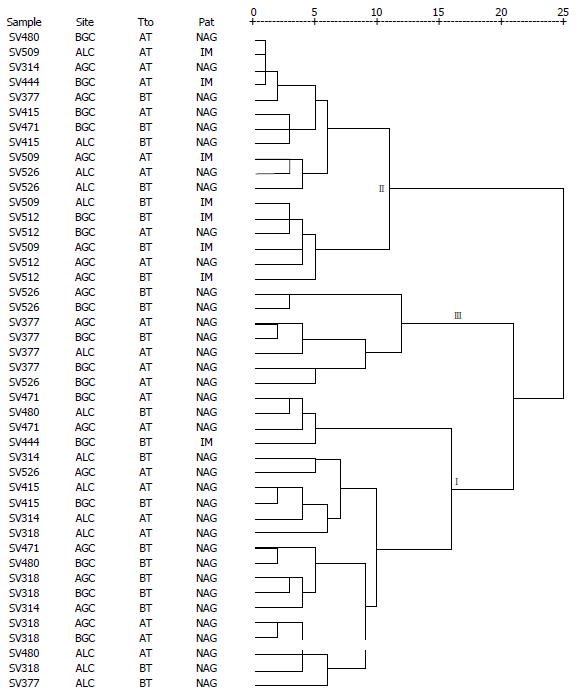
Figure 2 Dendogram of the random amplified polymorphic DNA profile generated with primer 1254 in Helicobacter pylori isolates obtained before (first endoscopy) and after (second endoscopy) treatment in patients with treatment failure.
Three separate conglomerates (I, II, and III) are indicated. Most of the H. pylori isolates associated to chronic non-atrophic gastritis (19/36) and intestinal metaplasia (7/8) were included in conglomerate I and II, respectively (P = 0.006). No significant differences were noted in the segregation of isolates according to the anatomical site and exposure to treatment (P = 0.700 and P = 0.851, respectively). Conglomerate analyses were designed following Ward’s conglomeration method and estimation of distances between each pair or group of isolates were calculated with the squared Euclidean distance. Distances between isolates are given in a 25-point standardized scale, where the fingerprints with distances below or equal to 5 were considered related and distances greater than 5 were considered unrelated. AT: After treatment; BT: Before treatment; NAG: Non-atrophic gastritis; IM: Intestinal metaplasia; H. pylori: Helicobacter pylori; ALC: Antrum lesser curvature; AGC: Antrum greater curvature; BGC: Body greater curvature.
- Citation: Bustamante-Rengifo JA, Matta AJ, Pazos AJ, Bravo LE. Effect of treatment failure on the CagA EPIYA motif in Helicobacter pylori strains from Colombian subjects. World J Gastroenterol 2017; 23(11): 1980-1989
- URL: https://www.wjgnet.com/1007-9327/full/v23/i11/1980.htm
- DOI: https://dx.doi.org/10.3748/wjg.v23.i11.1980


