Copyright
©The Author(s) 2016.
World J Gastroenterol. Feb 21, 2016; 22(7): 2304-2313
Published online Feb 21, 2016. doi: 10.3748/wjg.v22.i7.2304
Published online Feb 21, 2016. doi: 10.3748/wjg.v22.i7.2304
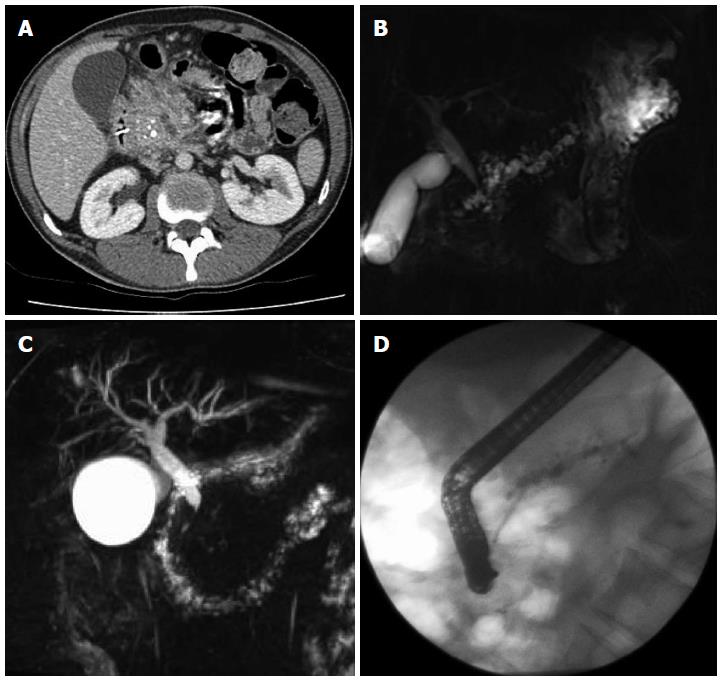
Figure 1 Computed tomography demonstrating enlarged head of pancreas with coarse calcification and a dilated main pancreatic duct (A), magnetic resonance cholangiopancreatography showing a tortuous, dilated pancreatic duct (B), inflammatory stricture of the distal common bile duct (C), endoscopic retrograde cholangiopancreatography showing a stent placed in a dilated pancreatic duct (D).
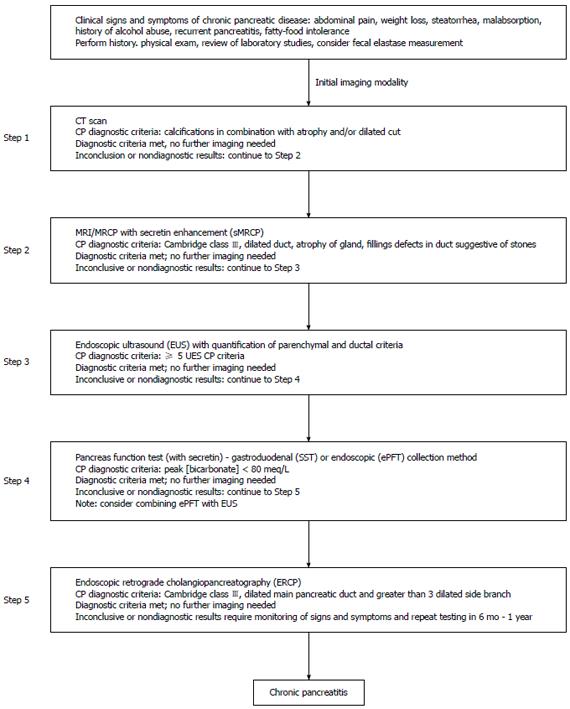
Figure 2 Step-wise algorithm approach to diagnosis of chronic pancreatitis.
Step 1: Survey (data review, risk factors, CT-imaging); Step 2: Tomography (pancreas protocol CT scan, MRI/secretin-enhanced magnetic resonance cholangiopancreatography); Step 3: Endocopy [EUS (standard criteria)]; Step 4: Pancreas functioning (Dreiling, ePFT); Step 5: ERCP (with intent for therapeutic intervention). From Conwell et al[2]. CT: Computed tomography; MRI: Magnetic resonance imaging; EUS: Endoscopic ultrasound; ERCP: Endoscopic retrograde cholangiopancreatography.
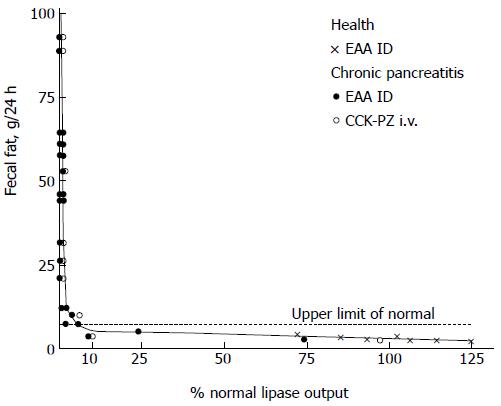
Figure 3 Relation of lipase outputs per 24 h to fecal fat excretion in healthy subjects and patients with chronic pancreatitis.
Values above the horizontal dashed line denote steatorrhea (> 7 g per 24 h). The shaded area represents lipase outputs less than 10 percent of normal. From DiMagno et al[34]. Copyright © 2015 Massachusetts Medical Society. Reprinted with permission from Massachusetts Medical Society.
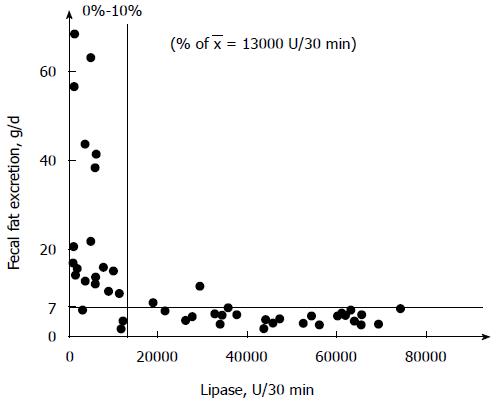
Figure 4 Relation of lipase output to fecal fat excretion in 47 patients with exocrine insufficiency.
Reprinted with permission from Lankisch et al[35]. Copyright © 2015 Karger Publishers, Basel, Switzerland.
- Citation: Duggan SN, Ní Chonchubhair HM, Lawal O, O’Connor DB, Conlon KC. Chronic pancreatitis: A diagnostic dilemma. World J Gastroenterol 2016; 22(7): 2304-2313
- URL: https://www.wjgnet.com/1007-9327/full/v22/i7/2304.htm
- DOI: https://dx.doi.org/10.3748/wjg.v22.i7.2304


