Copyright
©The Author(s) 2016.
World J Gastroenterol. Dec 28, 2016; 22(48): 10575-10583
Published online Dec 28, 2016. doi: 10.3748/wjg.v22.i48.10575
Published online Dec 28, 2016. doi: 10.3748/wjg.v22.i48.10575
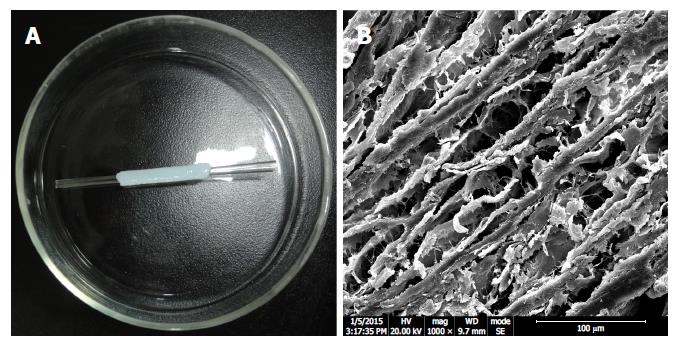
Figure 1 Appearance and structure of a graft used in common bile duct reconstruction.
A: The decellularized ureteral graft is over a stent. B: Scanning electron microscope photogram shows porous extracellular matrix and collagen fibers. Scanning bar indicates 100 μm.
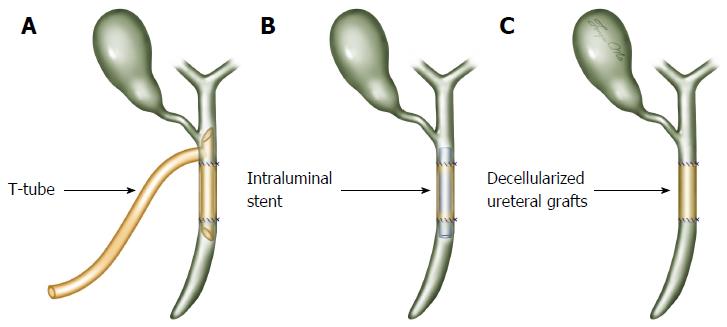
Figure 2 Surgical technique of common bile duct reconstruction.
A: The common bile duct defect was reconstructed with a 2 cm long decellularized ureteral graft over the lower limb of the T-tube (T-tube group); B: The defect was reconstructed with a graft over an intraluminal stent (stent group); C: The defect was reconstructed with a graft alone without any T-tube or intraluminal stent insertion (stentless group).
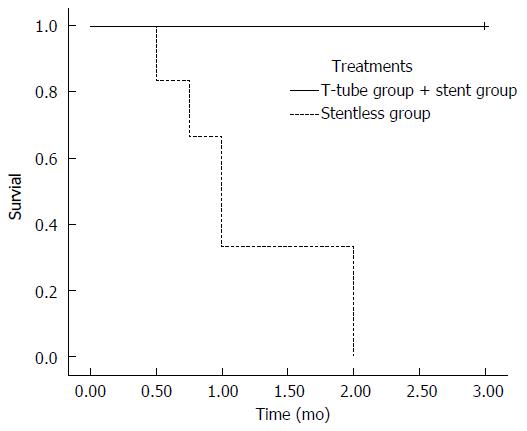
Figure 3 Survival rates.
All animals in the T-tube group and stent group survived until their sacrifice after 3 mo. In stentless group, all of the animals died in 2 mo.
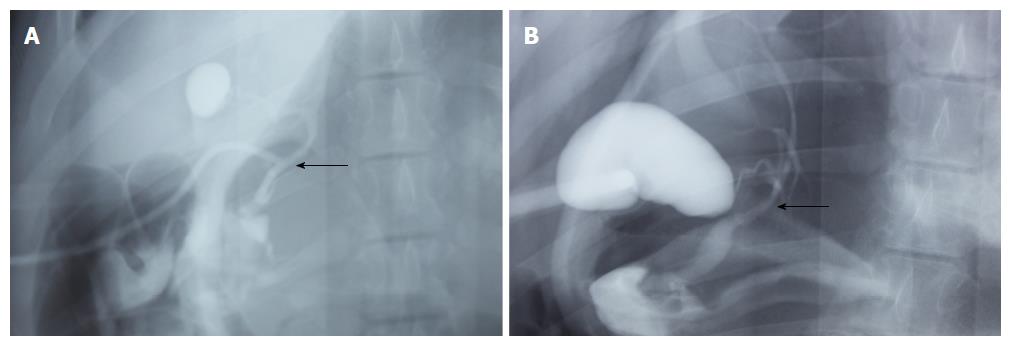
Figure 4 Postoperative cholangiography.
A: Cholangiography of a survivor in the T-tube group performed at 3 mo; B: Cholangiography of a survivor in the stent group performed at 3 mo. Arrows indicate the area of graft interposition. There is no evidence of biliary stricture formation. There is no sign of proximal dilatation or biliary obstruction.
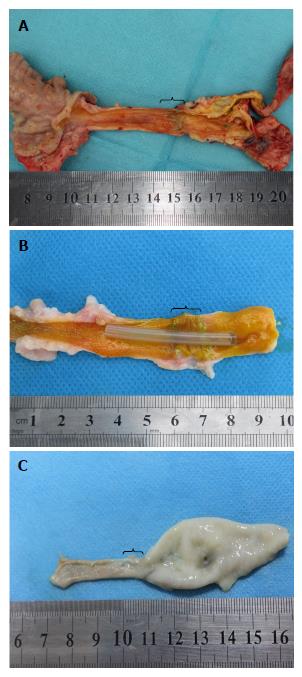
Figure 5 Macroscopic results.
A: Explanted bile duct of a 3-mo survivor in the T-tube group; B: Explanted bile duct of a 3-mo survivor in the stent group; C: Explanted bile duct of an animal who died at 1 mo in the stentless group. Brackets indicate the area of graft interposition.
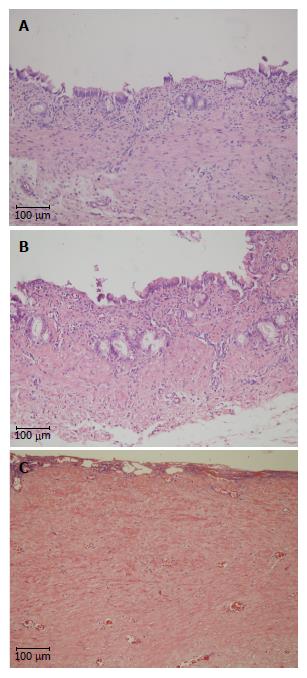
Figure 6 Hematoxylin/eosin staining of the graft site.
A: H&E staining of a 3-mo survivor in the T-tube group; B: H&E staining of a 3-mo survivor in the stent group; C: H&E staining of an animal who died at 1 mo in the stentless group. Scale bar indicates 100 μm. H&E: Hematoxylin/eosin.
Figure 7 Cytokeratin 19 immunofluorescent staining of the graft site.
A: CK19 staining of a 3-mo survivor in the T-tube group; B: CK19 staining of a 3-mo survivor in the stent group; C: CK19 staining of an animal who died at 1 mo in the stentless group. Scale bar indicates 20 μm. CK19: Cytokeratin 19.
- Citation: Cheng Y, Xiong XZ, Zhou RX, Deng YL, Jin YW, Lu J, Li FY, Cheng NS. Repair of a common bile duct defect with a decellularized ureteral graft. World J Gastroenterol 2016; 22(48): 10575-10583
- URL: https://www.wjgnet.com/1007-9327/full/v22/i48/10575.htm
- DOI: https://dx.doi.org/10.3748/wjg.v22.i48.10575


