Copyright
©The Author(s) 2016.
World J Gastroenterol. Dec 28, 2016; 22(48): 10482-10501
Published online Dec 28, 2016. doi: 10.3748/wjg.v22.i48.10482
Published online Dec 28, 2016. doi: 10.3748/wjg.v22.i48.10482
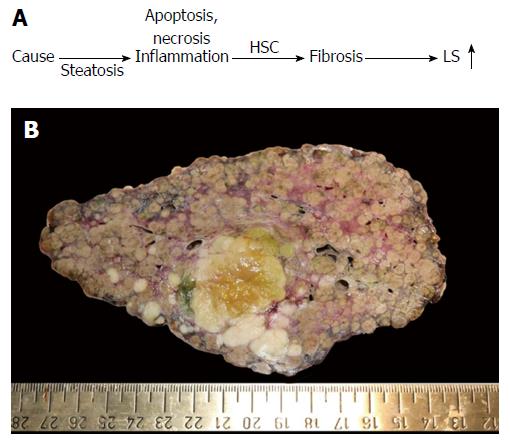
Figure 1 Liver fibrosis.
A: Conventional sequence of fibrosis progression. Here, elevated liver stiffness (LS) is primarily regarded as correlate of matrix deposition (fibrosis stage); B: Macroscopic aspect of a cirrhotic liver in a patient with alcoholic liver disease (courtesy of C. Lackner, University of Graz). Note the large fibrous septa spanning through the whole organ which are clearly visible at the macroscopic level. In addition, a primary liver cancer (HCC) can be seen (green area). HCC: Hepatocellular carcinoma; HSC: Hepatic stellate cells.
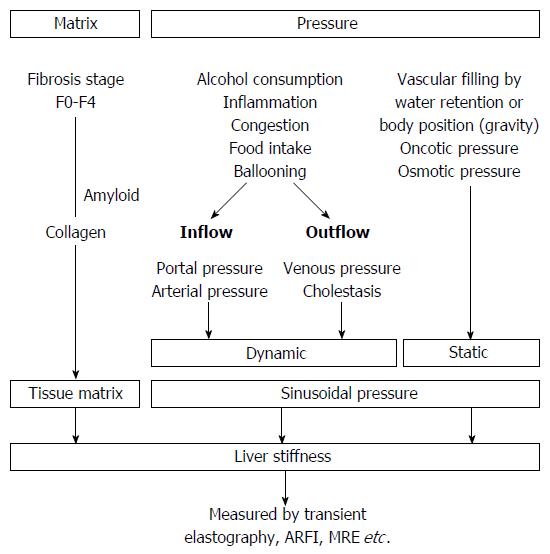
Figure 2 Liver stiffness is modulated both by matrix and pressure-associated conditions.
Both dynamic and static components affect the sinusoidal pressure. MRE: Magnetic resonance elastography; ARFI: Acoustic radiation force imaging.
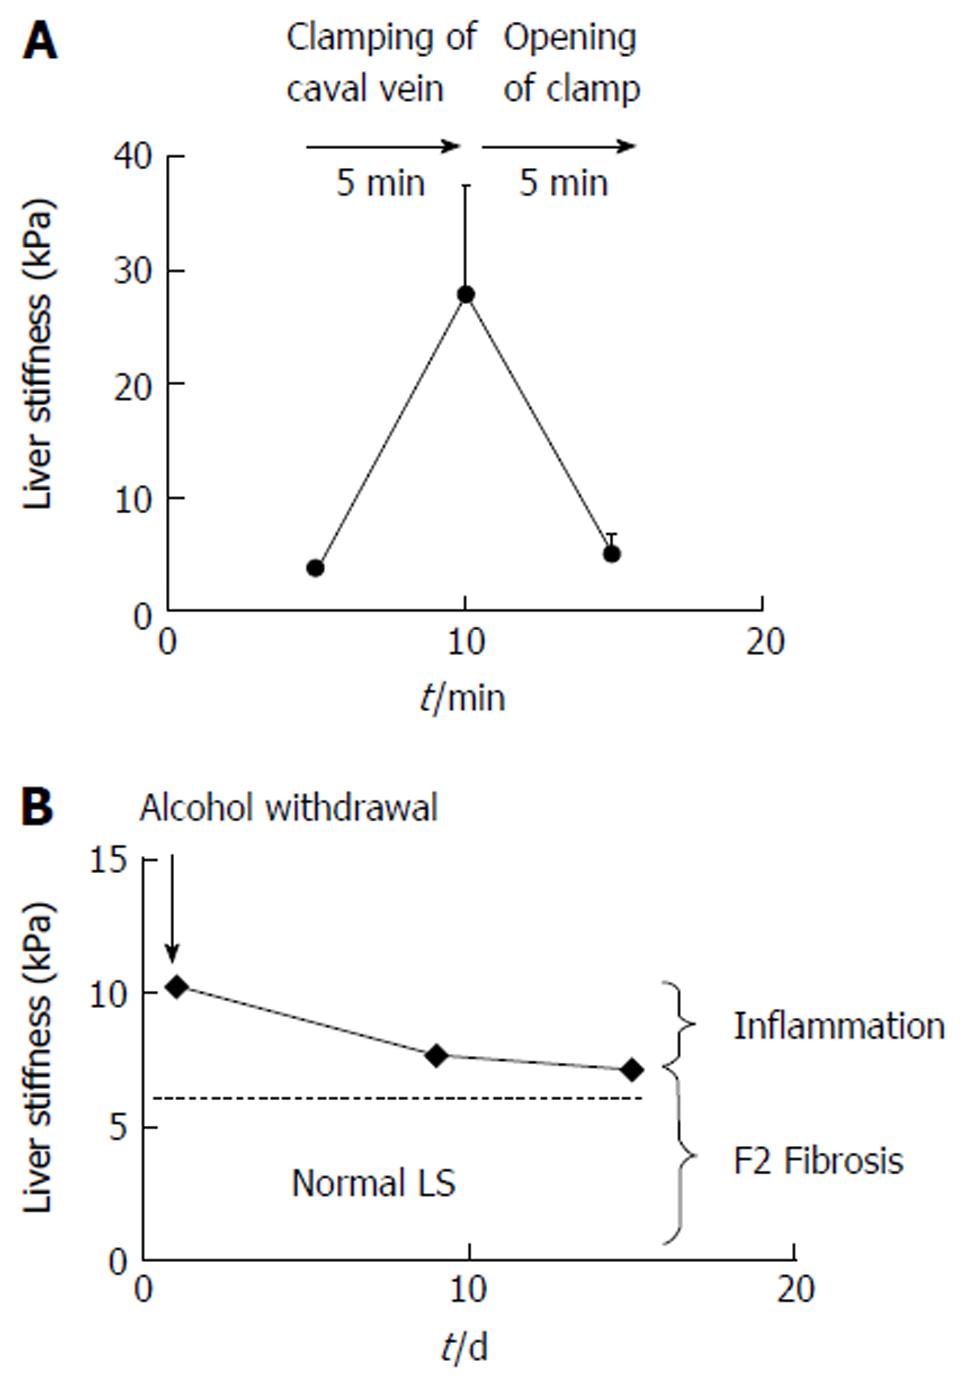
Figure 3 Examples of reversible pressure-mediated changes of liver stiffness.
A: Reversible drastic increase of liver stiffness (LS) after clamping of the caval vein in narcotized landrace pigs (modified from Ref. [25]); B: Decrease of LS after alcohol detoxification in a heavy female drinker unmasks the inflammation-related LS from the fibrosis-related LS. F2 fibrosis was confirmed histologically. Modified from Ref. [29].
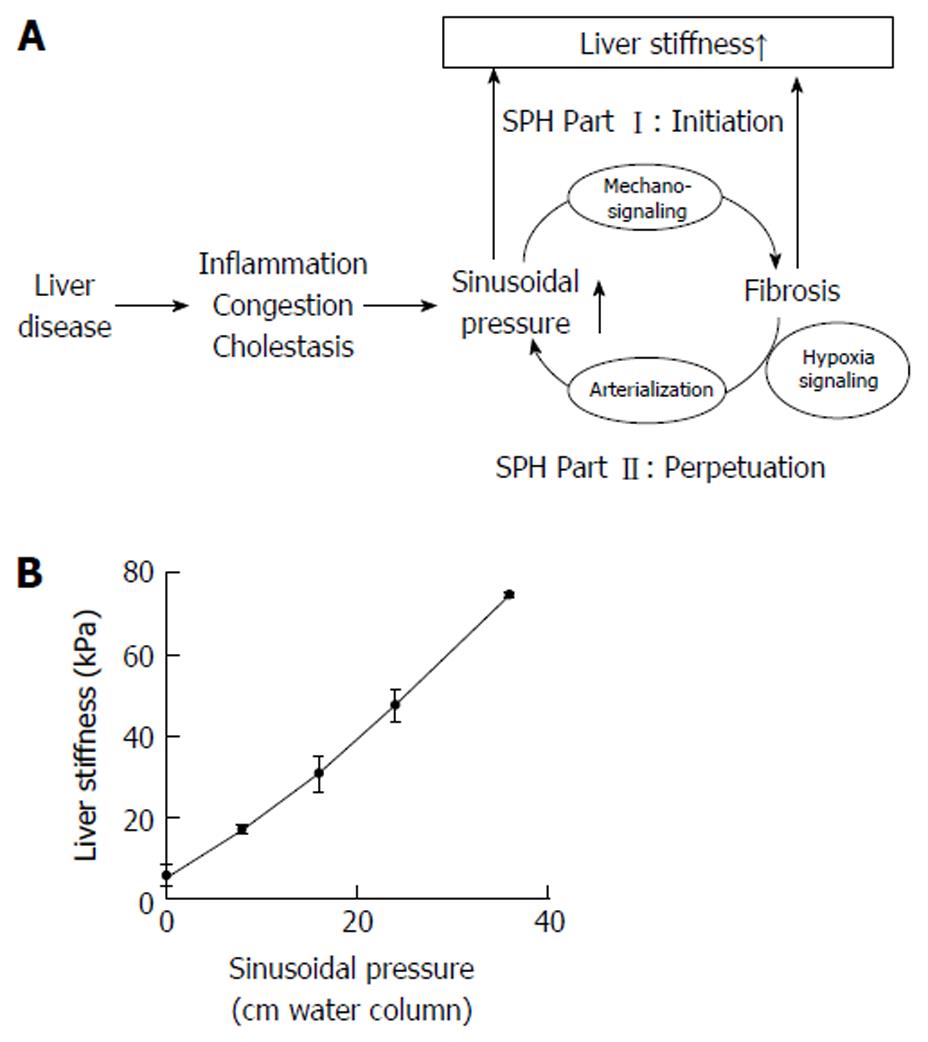
Figure 4 The sinusoidal pressure hypothesis and the role of liver stiffness.
A: Sinusoidal pressure hypothesis at the whole organ level. SP is the driving force of matrix deposition. Irrespective of the etiology, all liver pathologies (shown in the left) increase the SP that initiates matrix deposition via specific inter- and intracellular biomechanic signaling pathways (SPH Part I, Initiation). LS should be regarded as the combined read-out of elevated pressure and fibrosis. Both SP elevation and matrix deposition increase vascular resistance that ultimately lead to elevated hepatic arterial flow and finally complete arterial blood supply. The arterial response is mainly driven by hypoxia signaling and metabolic demand. Depending on dosage (> 12 mmHg) and time (> 4 wk), this vicious cycle will ultimately cause a complete arterialization leading to irreversible cirrhosis by exposing the low pressure organ to permanent high pressure (SPH Part II, Perpetuation); B: LS almost linearly depends on sinusoidal pressure in an isolated pig liver. In this experiment (modified from [25]), all vessels (caval and portal vein, hepatic artery and common bile duct) were ligated. The isolated organ was increasingly filled with isotonic sodium chloride solution and put under pressure. Under these conditions, according to the physical law of communicating pipes, the pressure within the caval or portal vein directly matches the SP. Similar to compliance studies in lungs, LS will show a slower increase at higher SP levels (not shown). LS: Liver stiffness; SP: Sinusoidal pressure; SPH: Sinusoidal pressure hypothesis.
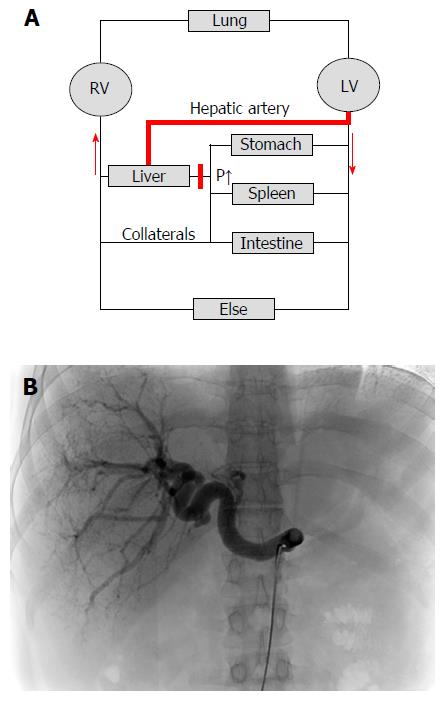
Figure 5 Cirrhotic livers are primarily supplied with blood by the hepatic artery (arterialization).
A: Hemodynamics of the low-pressure organ liver in the context of systemic circulation. Cirrhosis causes an increased vascular resistance, collateral formation and increased hepatic arterial flow to maintain hepatic perfusion. Elevated hepatic arterial flow can be observed already before the onset of fibrosis. It eventually leads to a complete arterialization of the cirrhotic liver. In some cases, portal flow completely reverses (so called hepatofugal flow) and hepatic blood exits the liver both via hepatic and portal veins. Note that the blood circulation (red arrows) is functionally maintained by two serial pumps (RV and LV). A dysbalance of these two pumps such as observed during right heart failure can also cause higher SP (congestion) and ultimately cardiac liver cirrhosis; B: Cirrhotic livers are characterized by predominant arterial blood supply. CT angiography of a patient with liver cirrhosis showing a prominent hepatic artery in 31 years old female patient with cryptogenic liver cirrhosis Child A (courtesy of Dr. B. Radeleff, University of Heidelberg). Under such conditions, the hepatic artery supplies the liver with more than 80% of blood. RV: Right ventricle; LV: Left ventricle; CT: Computed tomography.
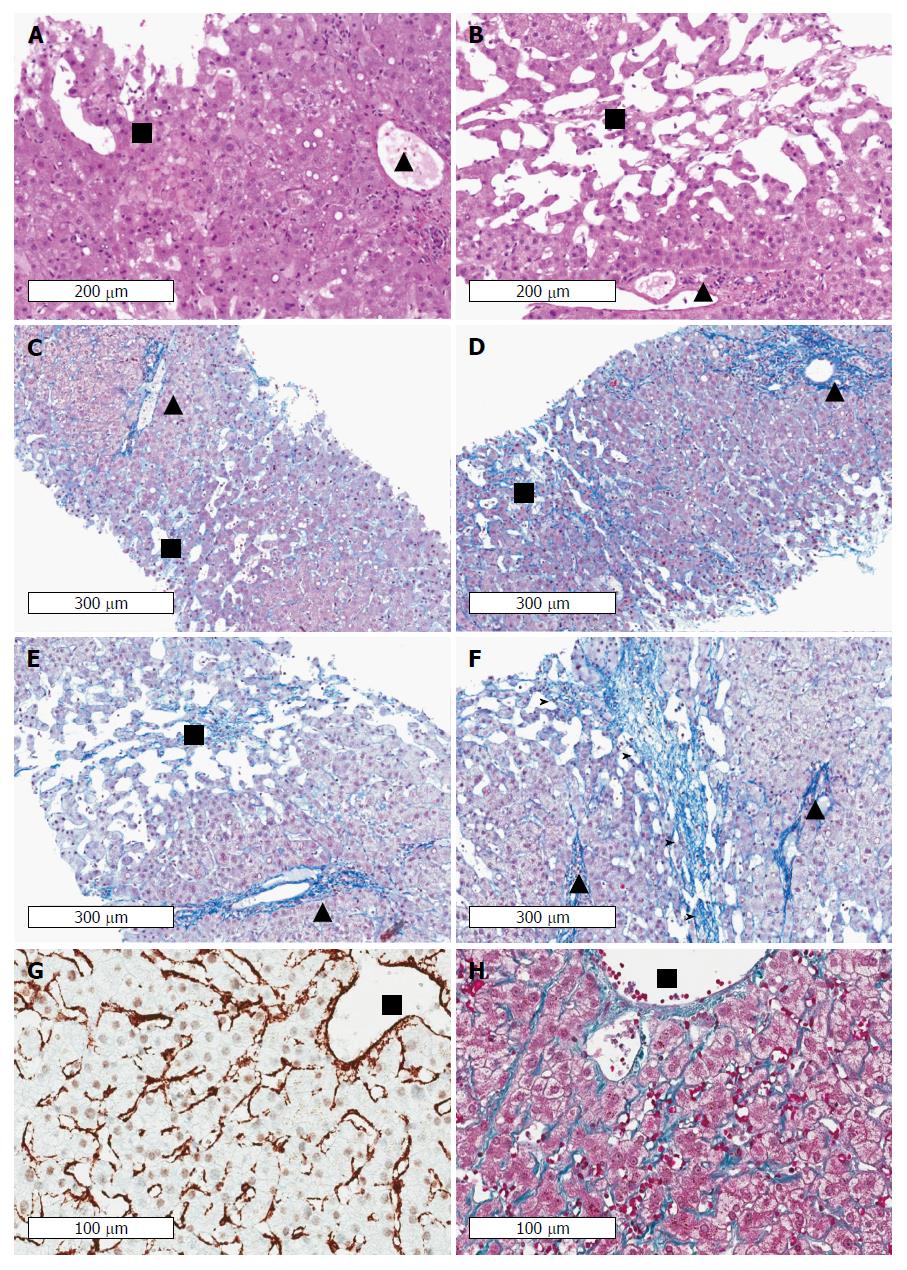
Figure 6 Cardiac cirrhosis as example of a pressure-associated cirrhosis in the absence of notable inflammation.
Patients with congestive heart failure may even die from complications of cirrhosis such as variceal bleeding or liver cancer. Note the absence of inflammation in areas with sinusoidal dilation and congestion in long-lasting congestion characterized by marked sinusoidal dilation and atrophy of liver cell plates. Early (A) and advanced (B) stages of congestive heart failure stained by hematoxyline and eosin. Portal tracts and centrilobular areas are marked with black triangles and squares, respectively. Inflammation is also not a feature in areas with sinusoidal dilation and congestion in intermediate and central portions of the lobules. C: Chromotrope aniline blue stain (fibrosis) of an early stage of congestive hepatopathy in a case with congestive heart failure. The portal tract and its structures is regular whereas in central and intermediate portions of the hepatic lobulus mild sinusoidal dilation, slight atrophy of liver cell plates and minimal perisinusoidal fibrosis are seen. D: If venous outlaw obstruction persists perisinusoidal fibrosis and atrophy of liver cell plates in centrilobular areas become more pronounced, (E) which is then followed by loss of liver cell plates and centrilobular fibrosis extending towards neighbouring central veins (F) finally resulting in fibrous septa (marked by arrow heads). Notably, portal-central relations are mostly preserved. Stain for αSMA (G) and fibrosis (Masson trichrome) (H) indicating septal and perisinusoidal fibrosis from a liver biopsy of a 31 years-old male patient with Fontan circulation. The images show diffuse activation of hepatic stellate cells in the absence of any inflammation. Fontan intervention was performed early around birth because of an unilateral ventricle. HVPG was 1 mmHg, LS was 19 kPa. (Images A-F: Courtesy of Dr. C. Lackner, University of Graz; images G-H: Courtesy of Dr. P. Bedossa, Hôpital Beaujon, Université Paris Diderot). HVPG: Hepatic venous pressure gradient; LS: Liver stiffness.
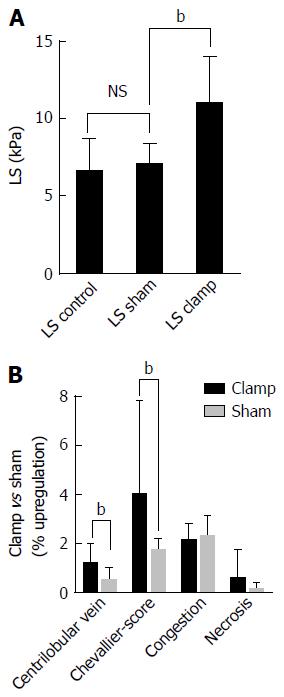
Figure 7 Example of a purely pressure-driven fibrosis: Experimental liver congestion over 4 mo causes significant non-inflammatory liver fibrosis.
The caval vein was subphrenically partly clamped in Wistar rats to cause hepatic congestion. A: Illustrates LS in male Wistar rats (n = 6) in control, sham operated and clamped group immediately after onset of congestion; B: Histological analysis of liver tissue sections shows a significant development of fibrosis after 4 mo of congestion in the clamped but not sham operated animals. (data from [27]), bP < 0.01. LS: Liver stiffness.
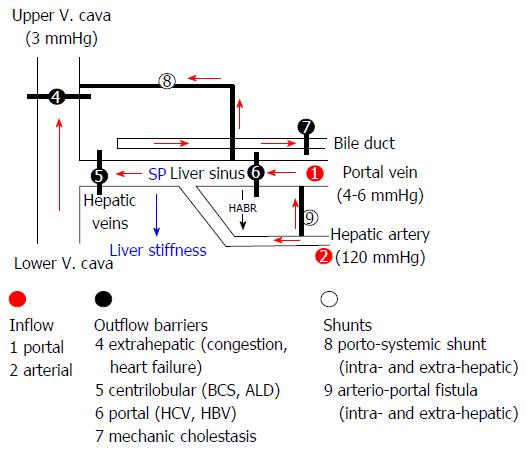
Figure 8 Sinusoidal pressure hypothesis at the vascular level.
Simplified scheme of the hepatic vascular architecture and conditions that result in elevated sinusoidal pressure (SP) and liver stiffness (LS). SP and LS are shown as consequence of the various inflow (red circles) and outflow balances (black circles) in a schematized vascular architecture of the liver. Intrahepatic or extrahepatic shunts (white circles) will also affect SP in a complex manner and, according to SPH, will also have an important impact on the development of portal hypertension and liver function. According to SPH, M1 (stiff livers with good liver function) and M2 (soft liver with poor liver function) can be postulated for patients with liver cirrhosis based on intrahepatic shunt formation. Red arrows: Flow direction; HABR: Hepatic arterial buffer response; SPH: Sinusoidal pressure hypothesis.
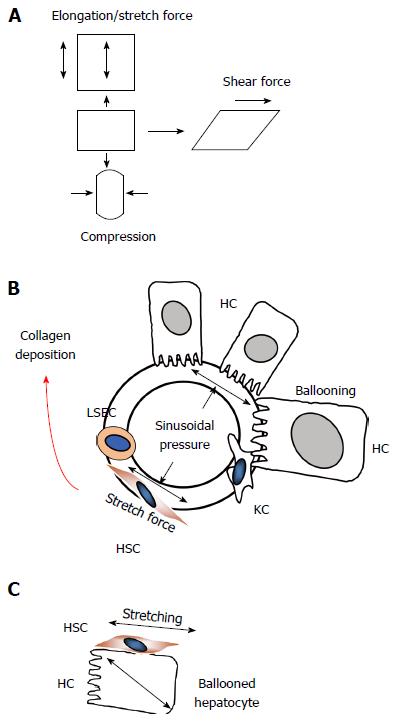
Figure 9 Sinusoidal pressure hypothesis at the cellular level.
A: Potential mechanic forces (stretch, compressing and shear forces) are shown that can act on cells; B: According to SPH, SP predominantly translates into mechanic stretch forces within the perisinusoidal bed. Hepatocyte cell death, inflammation or congestion all lead to increased SP that causes stretching of e.g., hepatic stellate cells (HSC), liver sinus endothelial cells (LSEC) or hepatocytes (HC); C: Moreover, intracellular pressure such as seen in ballooned hepatocytes can also cause stretch forces on the hepatocellular membrane and aligned HSC finally causing pericellular fibrosis.
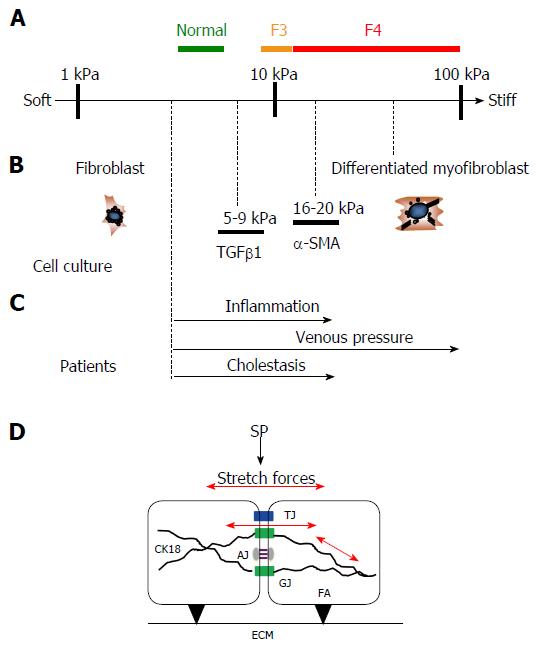
Figure 10 Similar stiffness values are found under pro-fibrogenic conditions in human and cellular studies.
A: Stiffness scale with cut off values for normal, F3 and F4 fibrosis (cirrhosis) in humans; B: Known stiffness conditions to activate fibroblasts using atomic force microscopy in cellular studies (modified from Ref. [37] ); C: Known LS values in various pathological conditions from human studies that ultimately cause liver fibrosis (modified from Ref. [3]); D: Potential intracellular and intercellular mechano-signaling via intercellular junctions through stretch forces caused by SP elevation. Besides interactions of focal adhesions (FA) with the extracellular matrix (ECM), SP causes intra- and intercellular stretch forces (red arrows) of perisinusoidal cells which are important for matrix production. Several intercellular junctions are schematically shown that may play an important role in biomechanic stretch signaling such as tight junctions (TJ), gap junctions (GJ) and adherence junctions (AJ). Intermediate filaments such as cytokeratin 18 (CK18) play a critical role in liver disease. CK18 is interacting with intercellular junctions and, hence, is most likely important for biomechanic signaling. LS: Liver stiffness; SP: Sinusoidal pressure.
- Citation: Mueller S. Does pressure cause liver cirrhosis? The sinusoidal pressure hypothesis. World J Gastroenterol 2016; 22(48): 10482-10501
- URL: https://www.wjgnet.com/1007-9327/full/v22/i48/10482.htm
- DOI: https://dx.doi.org/10.3748/wjg.v22.i48.10482


