Copyright
©The Author(s) 2016.
World J Gastroenterol. Dec 21, 2016; 22(47): 10353-10363
Published online Dec 21, 2016. doi: 10.3748/wjg.v22.i47.10353
Published online Dec 21, 2016. doi: 10.3748/wjg.v22.i47.10353
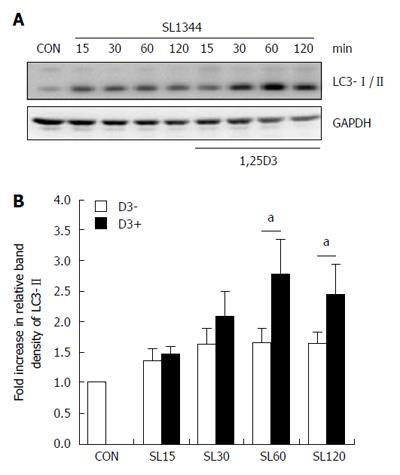
Figure 1 Effect of 1,25D3 on autophagy expression in Salmonella-infected Caco-2 cells.
Caco-2 cells were untreated (CON) or treated with 1,25D3 (D3) and then infected by S. typhimurium wild-type strain SL1344 (SL). Immunoblots were performed on whole cell lysates with antibody to detect autophagy LC3-I/II protein expression. The results shown are representative of three separate experiments. GAPDH was detected for normalization of cytosolic protein. Representative immunoblots (A) and densitometric quantification of immunoreactive bands (B) are shown. The relative band intensities of LC3-II in untreated (white) and treated (black) Caco-2 cells were quantified as fold-increases compared with the control cells.
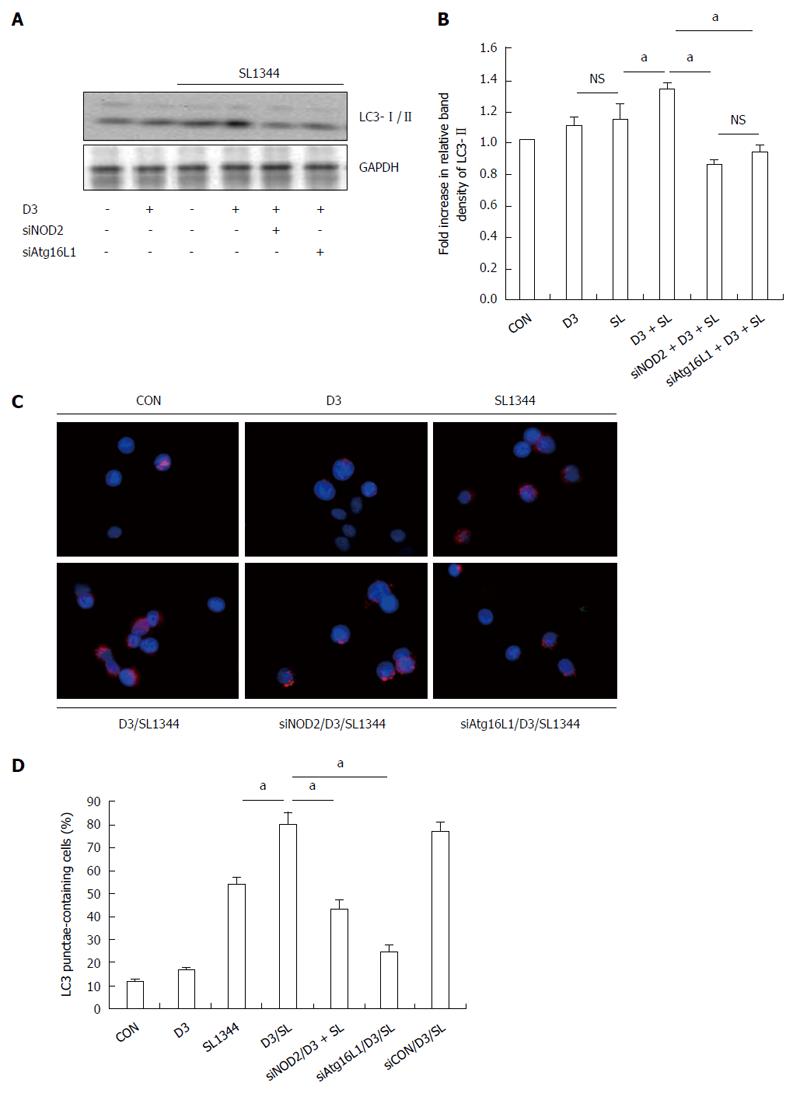
Figure 2 Involvement of NOD2 and Atg16L1 in 1,25D3-enhanced autophagy expression in Salmonella-infected Caco-2 cells.
Caco-2 cells were transfected with control siRNA, NOD2 siRNA or Atg16L1 siRNA (siCON: non-target control siRNA; siNOD2: siRNA to NOD2; siAtg16L1: siRNA to Atg16L1) for 48 h. The transfected cells were left uninfected (CON) or infected by wild-type S. typhimurium strain SL1344 (SL) in the absence or presence of 1,25D3 (D3). Knockdown of NOD2[21] and Atg16L1[18] was confirmed previously by Western blot. The transfected cells were pretreated with 1,25D3 prior to wild-type S. typhimurium strain SL1344 infection for 1 h. Immunoblotting was performed on whole cell lysates with antibody to detect autophagy LC3-I/II protein expression. The results shown are representative of three separate experiments. GAPDH was detected for normalization of cytosolic protein. Representative immunoblots (A) and densitometric quantification of immunoreactive bands (B) are shown. The relative band intensities of LC3-II in Caco-2 cells are quantified as fold-increases compared with the control cells. The cells were fixed, permeabilized and stained with anti-LC3 (red), and LC3 puncta formation was detected by a confocal microscope; representative images of LC3 punctae are depicted. Scale bar = 10 μm (C); The percentage of cells showing accumulation of LC3 punctae is reported (D). Data are mean ± SEM of three independent experiments. aP < 0.05.
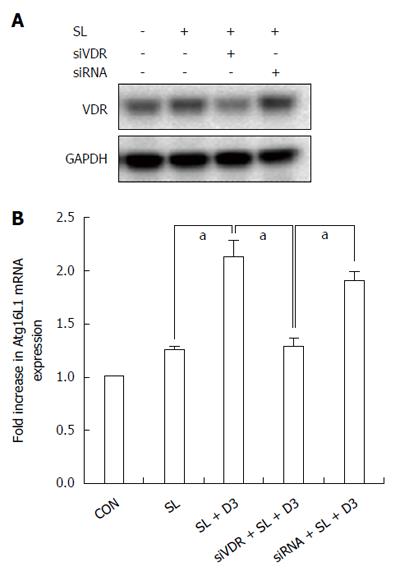
Figure 3 Effect of 1,25D3 on Atg16L1 mRNA expressions in Salmonella-infected Caco-2 cells and involvement of vitamin D receptor in the effect.
Caco-2 cells were transfected with control siRNA and vitamin D receptor (VDR) siRNA (siRNA: non-target control siRNA; siVDR: siRNA to VDR) for 48 h. The transfected cells were left uninfected (CON) or infected by wild-type S. typhimurium strain SL1344 in the absence or presence of 1,25D3. Western blots probed with antibodies against VDR and GAPDH confirmed knockdown of VDR (A). Total RNA was prepared after infection and analyzed by real-time quantitative PCR to estimate amounts of Atg16L1 transcript. The amount of Atg16L1 mRNA produced and normalized to the corresponding amount of GAPDH transcript is shown as the fold-increase over uninfected control cells (B). Results are presented as mean ± SEM for at least three determinations from independent experiments. aP < 0.05.
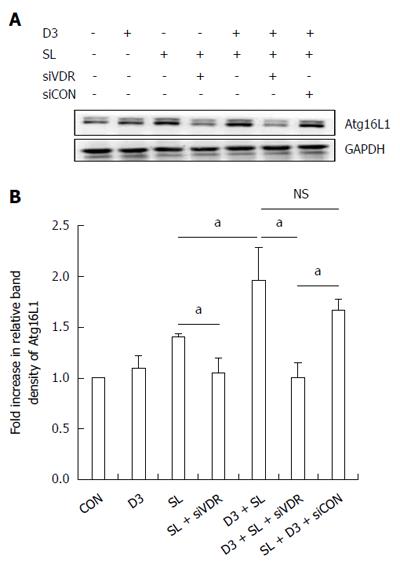
Figure 4 Effect of 1,25D3 on the membranous Atg16L1 protein expression in Salmonella-infected Caco-2 cells via vitamin D receptor.
Caco-2 cells were transfected with control siRNA and vitamin D receptor (VDR) siRNA (siCON: non-target control siRNA; siVDR: siRNA to VDR) for 48 h. The transfected cells were left uninfected (CON) or infected by wild-type S. typhimurium strain SL1344 (SL) in the absence or presence of 1,25D3 (D3). Immunoblots were performed on membrane lysates with antibody to detect Atg16L1 protein expression, and E-cadherin for normalization of membrane proteins. Representative immunoblots (A) and densitometric quantification of immunoreactive bands (B) are shown. The relative band intensities of Atg16L1 in Caco-2 cells were quantified as fold-increases compared with the control cells. Each value represents the mean ± SEM of three independent experiments. aP < 0.05.
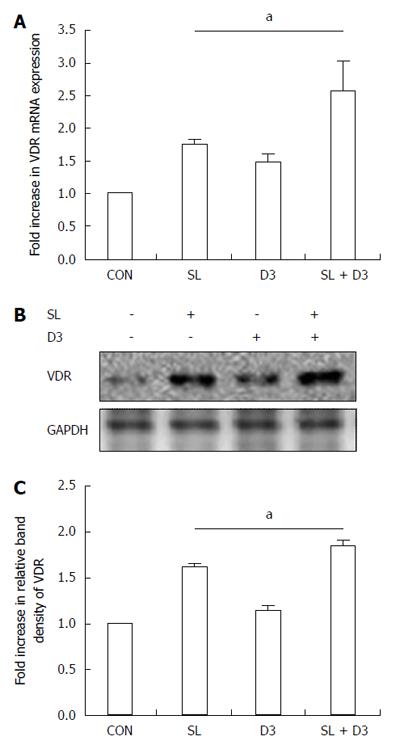
Figure 5 1,25D3 up-regulates the vitamin D receptor protein or mRNA expression in Salmonella-infected Caco-2 cells.
Caco-2 cells were uninfected (CON) or infected by wild-type S. typhimurium strain SL1344 (SL) at indicated times, in the presence or absence of 1,25D3 (D3). Total RNA was prepared after infection and analyzed by real-time quantitative PCR to estimate amounts of vitamin D receptor (VDR) transcript (A). The amount of VDR mRNA produced, normalized to the corresponding amount of GAPDH transcript, is shown as the fold-increase over uninfected control cells. Results are represented as mean ± SEM for at least three determinations from independent experiments. Immunoblotting was performed on whole cell lysates with an antibody to detect VDR protein expression, or GAPDH for normalization of proteins. Representative immunoblots (B) and densitometric quantification of immunoreactive bands (C) are shown; The relative band intensities of VDR (C) in Caco-2 cells were quantified as fold-increases compared with the control cells. Each value represents the mean ± SEM of three independent experiments. aP < 0.05.
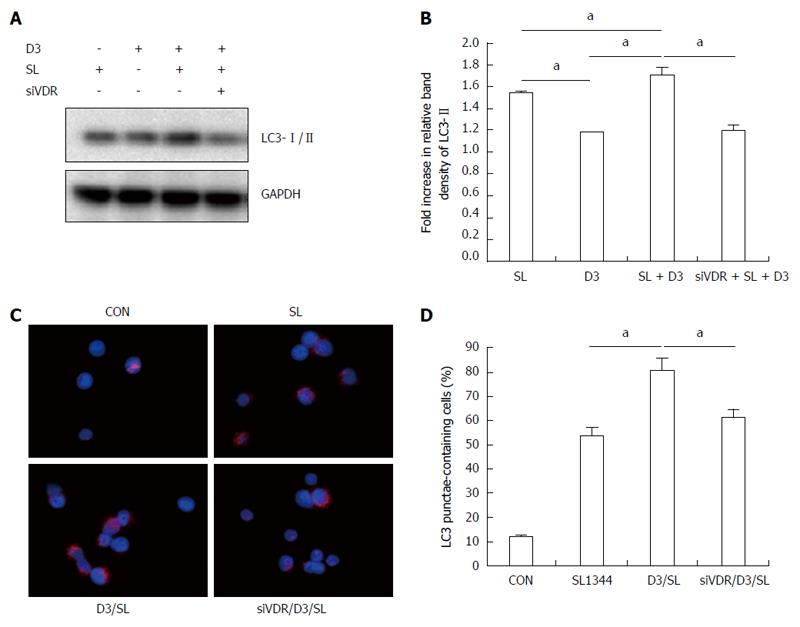
Figure 6 Involvement of vitamin D receptor in the enhanced effect of 1,25D3 on autophagy expression in Salmonella-infected Caco-2 cells.
Caco-2 cells were transfected with control siRNA and vitamin D receptor (VDR) siRNA (siVDR: siRNA to VDR) for 48 h. The transfected cells were left uninfected (CON) or infected by wild-type S. typhimurium strain SL1344 (SL) in the absence or presence of 1,25D3 (D3). Immunoblots were performed on whole cell lysates with antibody to detect autophagy LC3-I/II protein expression. The results shown are representative of three separate experiments. GAPDH was detected for normalization of cytosolic protein. Representative immunoblots (A) and densitometric quantification of immunoreactive bands are shown. The relative band intensities of LC3-II in Caco-2 cells are quantified as fold-increases compared with the control cells (B). The cells were fixed, permeabilized and stained with anti-LC3 (red), and LC3 puncta formation was detected by a confocal microscope. Representative images of LC3 punctae are depicted (C). Scale bar = 10 μm. The percentage of cells showing accumulation of LC3 punctae is reported (D). Each value represents the mean ± SEM of three independent experiments. aP < 0.05.
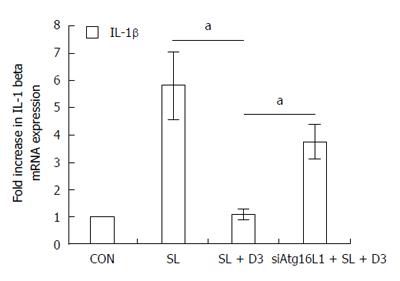
Figure 7 Involvement of Atg16L1 in suppressed Salmonella-induced IL-1β mRNA expression in Caco-2 cell by 1,25D3.
Caco-2 cells were transfected with control siRNA or Atg16L1 siRNA (siAtg16L1: siRNA to Atg16L1) for 48 h. Transfected Caco-2 cells were pretreated with 1,25D3 (D3) prior to wild-type S. typhimurium strain SL1344 (SL) infection for 1 h. Total RNA was prepared after infection and analyzed by real-time quantitative PCR to estimate amounts of IL-1β transcript. The amount of IL-1β mRNA produced, normalized to the corresponding amount of GAPDH transcript, is shown as the fold-increase over uninfected control cells (CON). Results are represented as mean ± SEM for at least three determinations from independent experiments. aP < 0.05.
- Citation: Huang FC. Vitamin D differentially regulates Salmonella-induced intestine epithelial autophagy and interleukin-1β expression. World J Gastroenterol 2016; 22(47): 10353-10363
- URL: https://www.wjgnet.com/1007-9327/full/v22/i47/10353.htm
- DOI: https://dx.doi.org/10.3748/wjg.v22.i47.10353


