Copyright
©The Author(s) 2016.
World J Gastroenterol. Nov 28, 2016; 22(44): 9734-9743
Published online Nov 28, 2016. doi: 10.3748/wjg.v22.i44.9734
Published online Nov 28, 2016. doi: 10.3748/wjg.v22.i44.9734
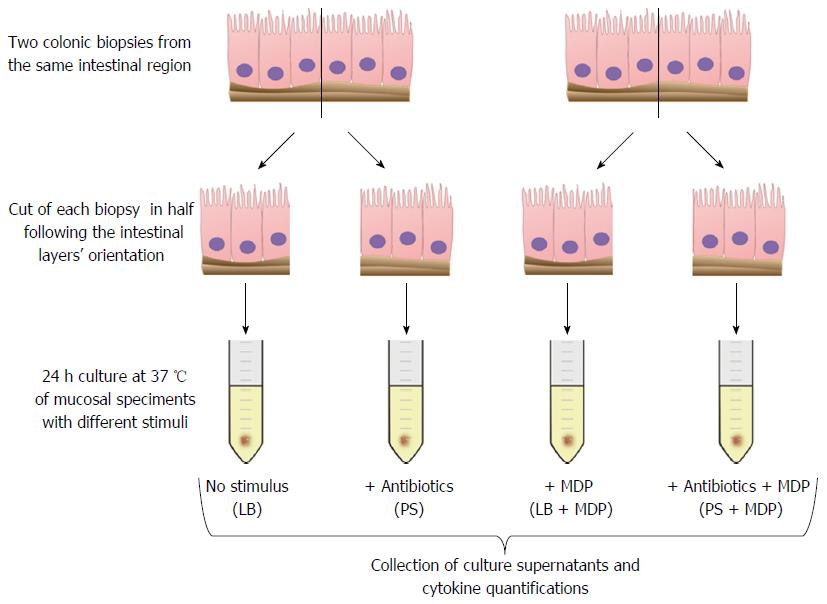
Figure 1 Schematic culture protocol of colonic biopsies derived from colonoscopy.
LB: Live Bacteria; PS: Penicillin-streptomicin; MDP: Muramyl dipeptide.
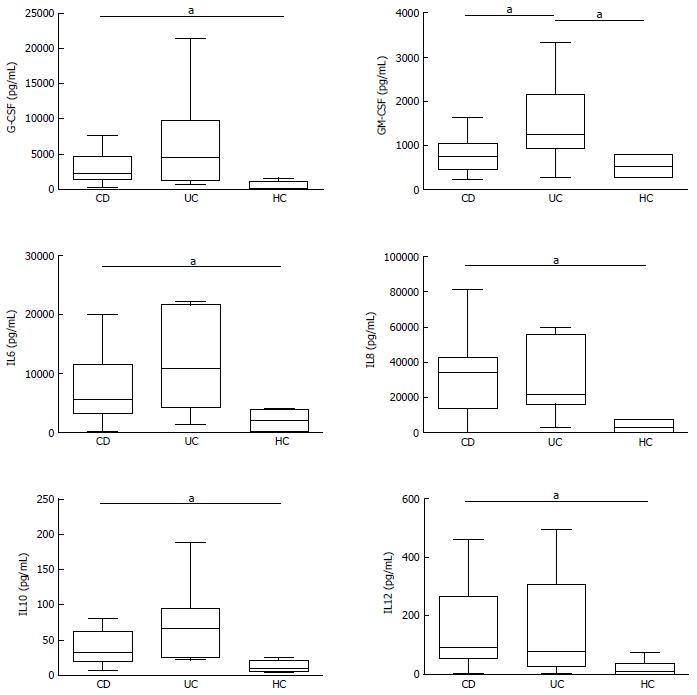
Figure 2 Cytokine secretion levels by colonic biopsies from inflammatory bowel diseases patients.
Levels of cytokine secretion by colonic biopsies from inflammatory bowel diseases (IBD) patients in active phase [Crohn’s disease (CD); ulcerative colitis (UC)] and healthy controls (HC) in basal condition [live bacteria (LB)]. Statistical significances are denoted using alphabetical letters (aP < 0.05).
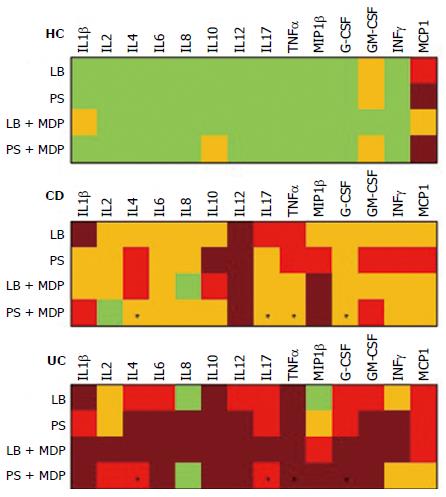
Figure 3 Color analog scale representing the median levels of all cytokines analyzed.
Median levels of all cytokines in healthy controls (HC), Crohn’s disease (CD) and ulcerative colitis (UC) groups in the four experimental conditions: live bacteria (LB), antibiotics (PS), live bacteria + Muramyl dipeptide (LB + MDP) and antibiotics + MDP (PS + MDP). For each cytokine, values 0-24% of the higher value are displayed in green, 25%-49% in orange, 50%-74% in red and above 75% in dark red. Asterisks indicate the set of cytokines whose measure allowed to discriminate CD from UC with 92% sensitivity and 50% specificity.
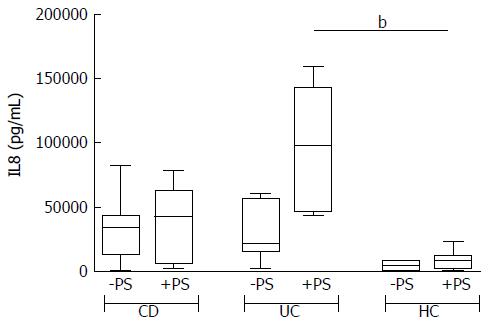
Figure 4 Dosage of IL8 secretion by colonic biopsies from inflammatory bowel diseases patients.
Levels of IL8 secretion by colonic biopsies from patients with active Crohn’s disease (CD), active ulcerative colitis (UC) and from healthy controls (HC), in the presence (+PS) or absence (-PS, live bacteria) of antibiotic mixture. Statistical significances are denoted using alphabetical letters (bP < 0.01).
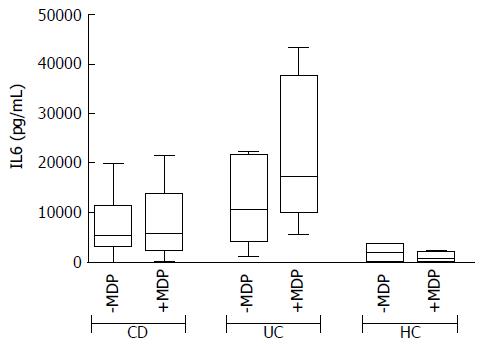
Figure 5 Representative trend of cytokine secretion after muramyl dipeptide stimulation, with live bacteria.
Variation trend of IL6 secretion after muramyl dipeptide (MDP) stimulation in patients suffering from active Crohn’s disease (CD), active ulcerative colitis (UC) and healthy controls (HC), in absence of antibiotics [live bacteria (LB)]. No statistical significance was found.
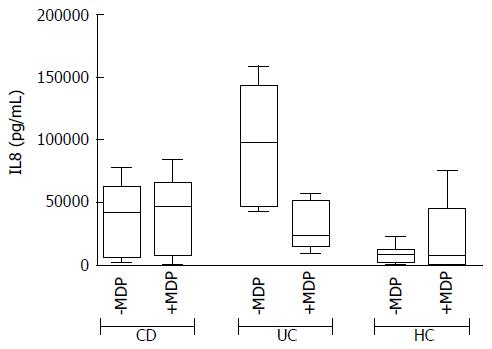
Figure 6 Representative trend of cytokine secretion after muramyl dipeptide stimulation, with antibiotics.
Variation trend of IL8 secretion after muramyl dipeptide (MDP) stimulation in patients suffering from active Crohn’s disease (CD), active ulcerative colitis (UC) and healthy controls (HC), in presence of antibiotics (+PS). No statistical significance was found.
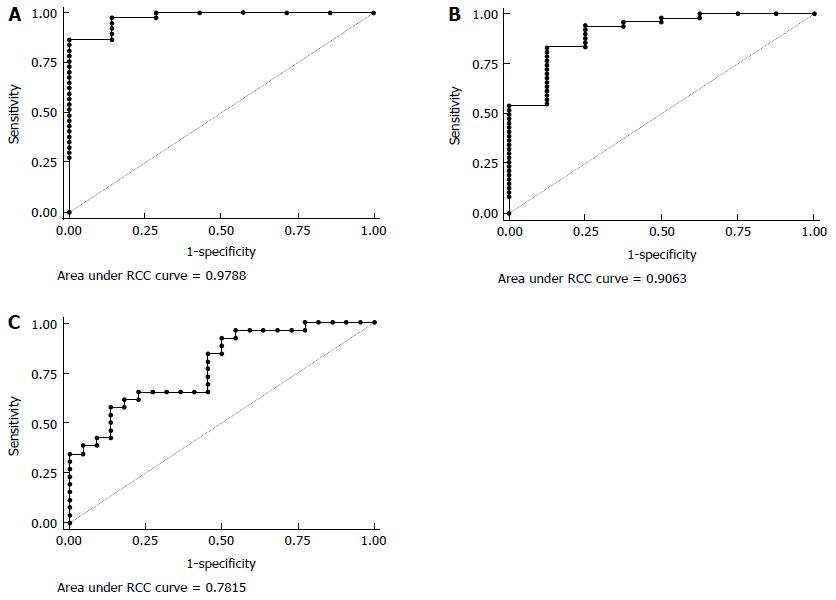
Figure 7 Multivariate combinations.
A: Roc curve of IL2, IL4 and IL8: the best cutoff value was for a sensitivity of 100% and specificity of 71% to discriminate IBD (UC and CD) from healthy controls (AUC = 0.98, 95%CI: 0.93-1.00); B: Roc curve of MCP1, IL8 and IL10: the best cutoff value was for a sensitivity of 94% and specificity of 75% to discriminate IBD (UC and CD) from healthy controls (AUC = 0.91, 95%CI: 0.79-1.00); C: Roc curve of G-CSF, TNFα, IL4 and IL17: the best cutoff value was for a sensitivity of 92% and specificity of 50% to discriminate CD from UC (AUC = 0.78, 95%CI: 0.65-0.91).
- Citation: Loganes C, Valencic E, Pin A, Marini E, Martelossi S, Naviglio S, De Leo L, Not T, Monasta L, Tommasini A, Marcuzzi A. Ex vivo response to mucosal bacteria and muramyl dipeptide in inflammatory bowel disease. World J Gastroenterol 2016; 22(44): 9734-9743
- URL: https://www.wjgnet.com/1007-9327/full/v22/i44/9734.htm
- DOI: https://dx.doi.org/10.3748/wjg.v22.i44.9734


