Copyright
©The Author(s) 2016.
World J Gastroenterol. Nov 21, 2016; 22(43): 9604-9612
Published online Nov 21, 2016. doi: 10.3748/wjg.v22.i43.9604
Published online Nov 21, 2016. doi: 10.3748/wjg.v22.i43.9604
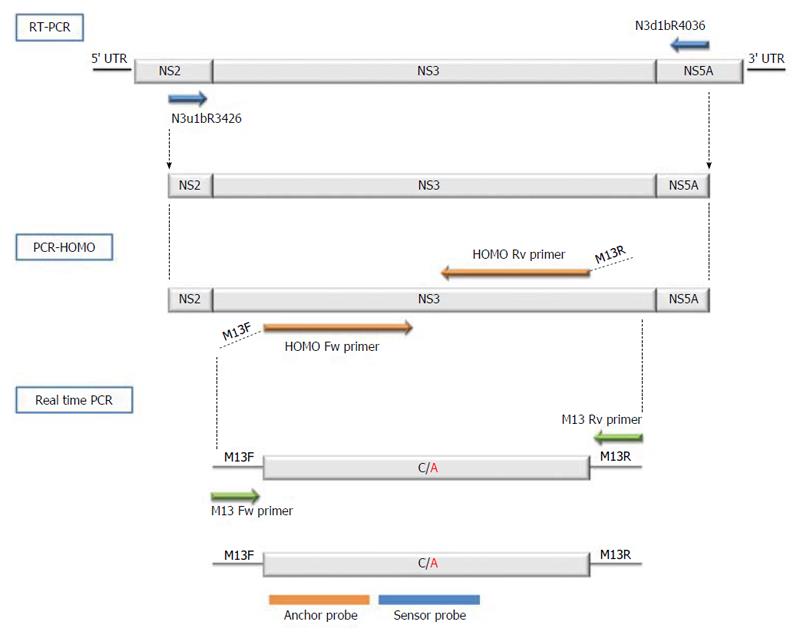
Figure 1 Diagram of the Q80K testing protocol.
RT-PCR was performed to obtain cDNA from the NS3 target containing the Q80K polymorphism, followed by HOMO-PCR performed to homogenize the Q80K flanking region using specific long primers. This PCR prepared the Q80K flanking region for the next step, in which specific probes are used to detect Q80K. The last step is a real-time PCR, in which the Q80K mutation was detected by analyzing the melting point of one of the two adjacent fluorescent-labeled probes. The specific and universal primers used are specified in each amplification step.
Figure 2 Melting peaks of the Q and K variants analyzed by LightCycler 2.
0. The variants were easily identified by their peak patterns, resulting from their characteristic melting temperatures. A: Tm for variant K approximate 59 °C; B: Tm for variant Q approximate 53 °C.
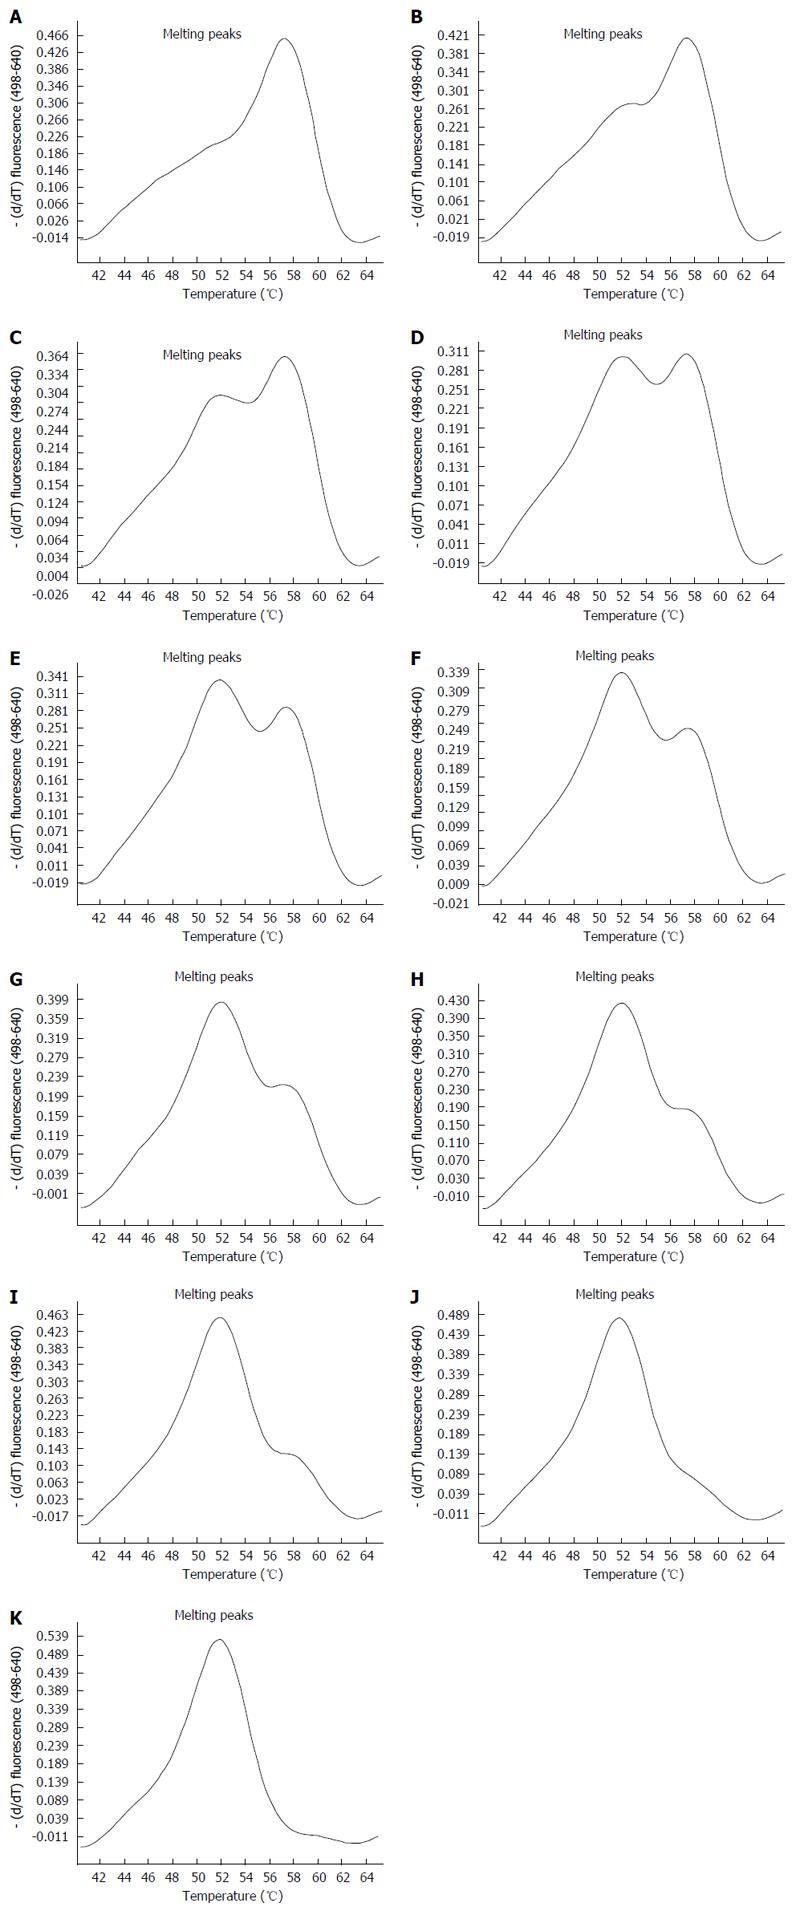
Figure 3 Melting peaks of mixtures carrying the Q and K variants analyzed by real-time technology.
The variations seen in the peak patterns are proportional to their content of variants (Q or K). Samples carrying the mutated variant can be easily identified, with a limit of detection of 10%. A: 100%K; B: 90%K/10%Q; C: 80%K/20%Q; D: 70%K/30%Q; E: 60%K/40%Q; F: 50%K/50%Q; G: 40%K/60%Q; H: 30%K/70%Q; I: 20%K/80%Q; J: 10%K/90%Q; K: 100%Q.
- Citation: Chen Q, Belmonte I, Buti M, Nieto L, Garcia-Cehic D, Gregori J, Perales C, Ordeig L, Llorens M, Soria ME, Esteban R, Esteban JI, Rodriguez-Frias F, Quer J. New real-time-PCR method to identify single point mutations in hepatitis C virus. World J Gastroenterol 2016; 22(43): 9604-9612
- URL: https://www.wjgnet.com/1007-9327/full/v22/i43/9604.htm
- DOI: https://dx.doi.org/10.3748/wjg.v22.i43.9604


