Copyright
©The Author(s) 2016.
World J Gastroenterol. Oct 28, 2016; 22(40): 8991-8998
Published online Oct 28, 2016. doi: 10.3748/wjg.v22.i40.8991
Published online Oct 28, 2016. doi: 10.3748/wjg.v22.i40.8991
Figure 1 The proximal contractile integral.
The proximal contractile integral (PCI) is calculated applying the same algorithm used for the distal contractile integral to quantify contractile pressure exceeding 20 mmHg in the region outlined by the white line. The high- resolution manometry tracing on the left refers to a patient with pathological oropharyngeal (OP) acid exposure (weaker PCI = lighter colors), while the tracing on the right refers to a patient with normal OP acid exposure (stronger PCI = darker color).
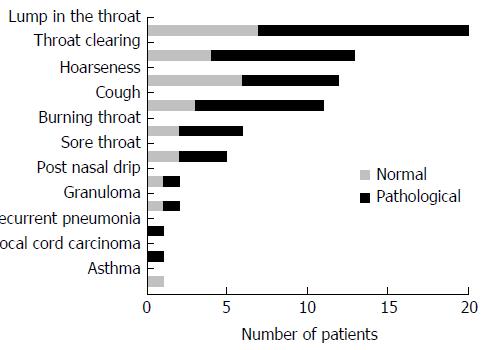
Figure 2 Clinical manifestations of the study population.
Number of patients with normal or pathological oropharyngeal acid exposure. Differences between groups are not statistically significant.
- Citation: Passaretti S, Mazzoleni G, Vailati C, Testoni PA. Oropharyngeal acid reflux and motility abnormalities of the proximal esophagus. World J Gastroenterol 2016; 22(40): 8991-8998
- URL: https://www.wjgnet.com/1007-9327/full/v22/i40/8991.htm
- DOI: https://dx.doi.org/10.3748/wjg.v22.i40.8991


