Copyright
©The Author(s) 2016.
World J Gastroenterol. Oct 28, 2016; 22(40): 8956-8966
Published online Oct 28, 2016. doi: 10.3748/wjg.v22.i40.8956
Published online Oct 28, 2016. doi: 10.3748/wjg.v22.i40.8956
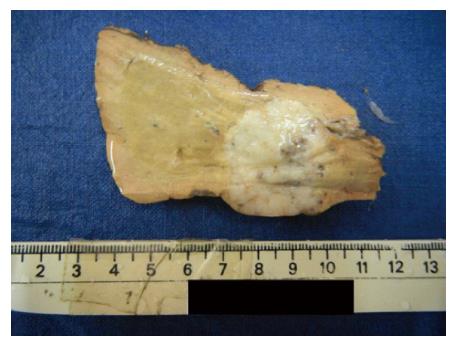
Figure 1 Liver with a fairly circumscribed tumor with a firm grey white cut surface.
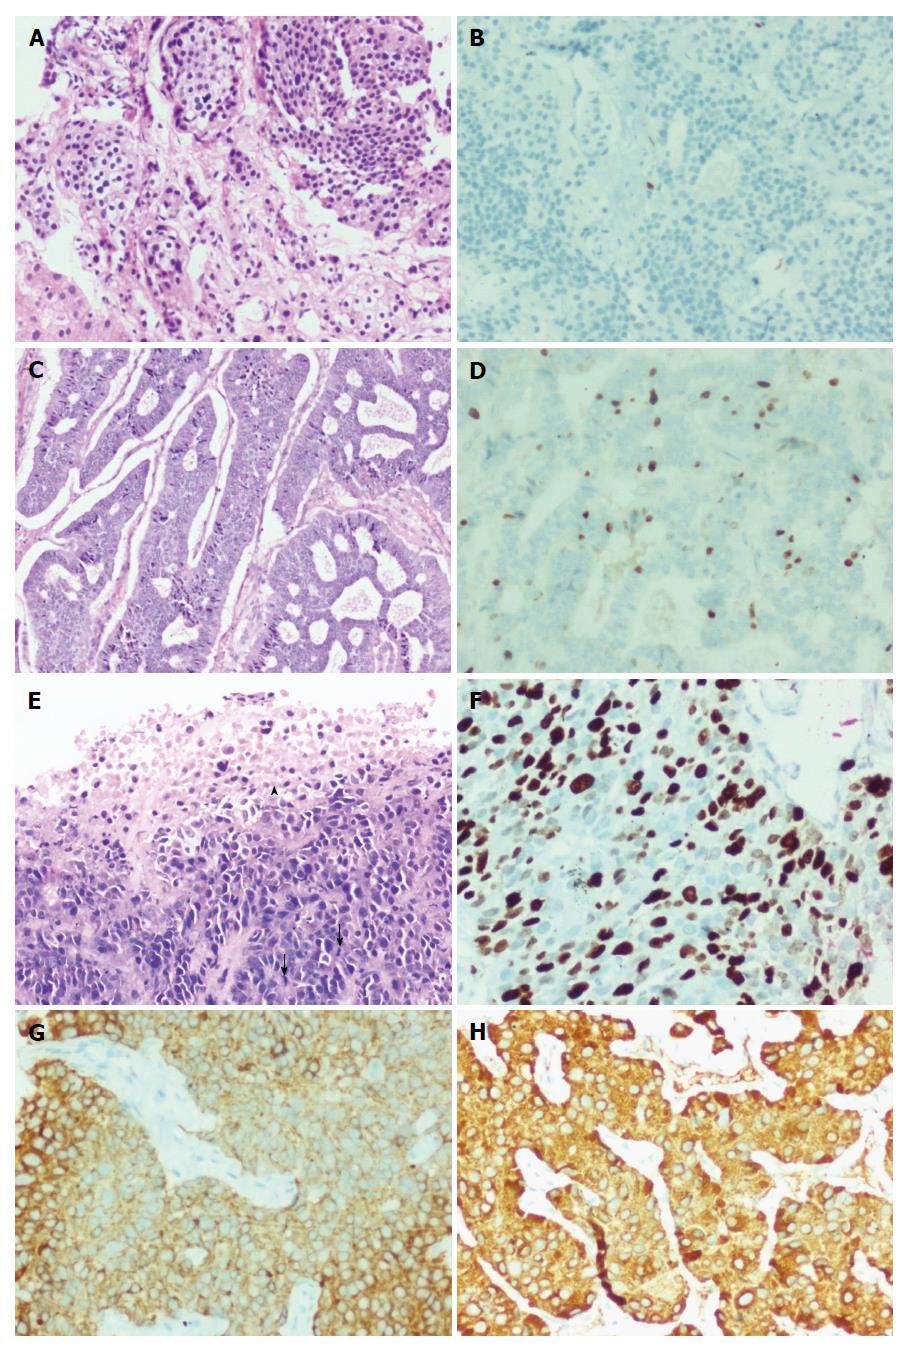
Figure 2 G1-G3 neuroendocrine neoplasms.
A: G1 - tumor with trabecular and nested pattern (H&E × 200); B: Tumor cells displaying Ki-67 index of < 1% (immunohistochemistry × 200); C: G2 - tumor with gyriform and festooning patterns and the tumor cells display mildly pleomorphic nuclei with coarse stippled chromatin (H&E × 200); D: Tumor cells displaying Ki-67 index of approximately 16% (immunohistochemistry × 200); E: G3 - tumor cells with pleomorphic and hyperchromatic nuclei displaying brisk mitotic (arrow) and apoptotic activity and focal necrosis (arrow head) (H&E × 200); F: Tumor cells displaying Ki-67 index of approximately 80% (immunohistochemistry × 200); G: Tumor cells displaying diffuse cytoplasmic positivity for synaptophysin (immunohistochemistry × 200); H: Tumor cells displaying diffuse cytoplasmic positivity for chromogranin (immunohistochemistry × 200).
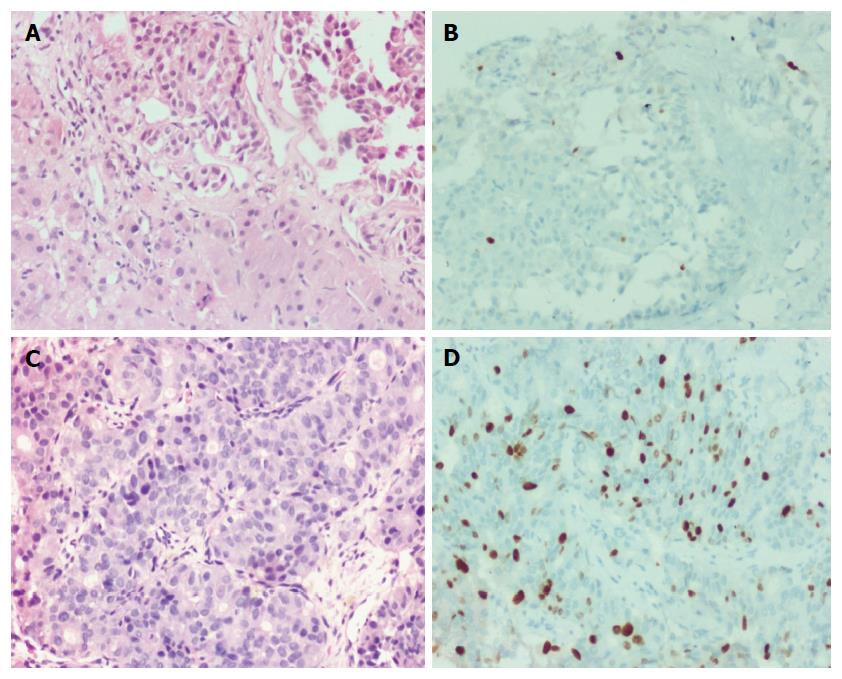
Figure 3 D1/D2 and D2/D3 neuroendocrine neoplasms.
A: D1/2 - liver biopsy showing clusters of tumor cells with uniform nuclei and no conspicuous mitotic activity (H&E × 200); B: Tumor cells displaying Ki-67 index of approximately 5% (immunohistochemistry × 200); C: D2/D3 shows tumor cells arranged in trabeculae and focal acinar pattern with mildly pleomorphic nuclei (H&E × 200); D: Tumor cells displaying Ki-67 index of approximately 30% (immunohistochemistry × 200).
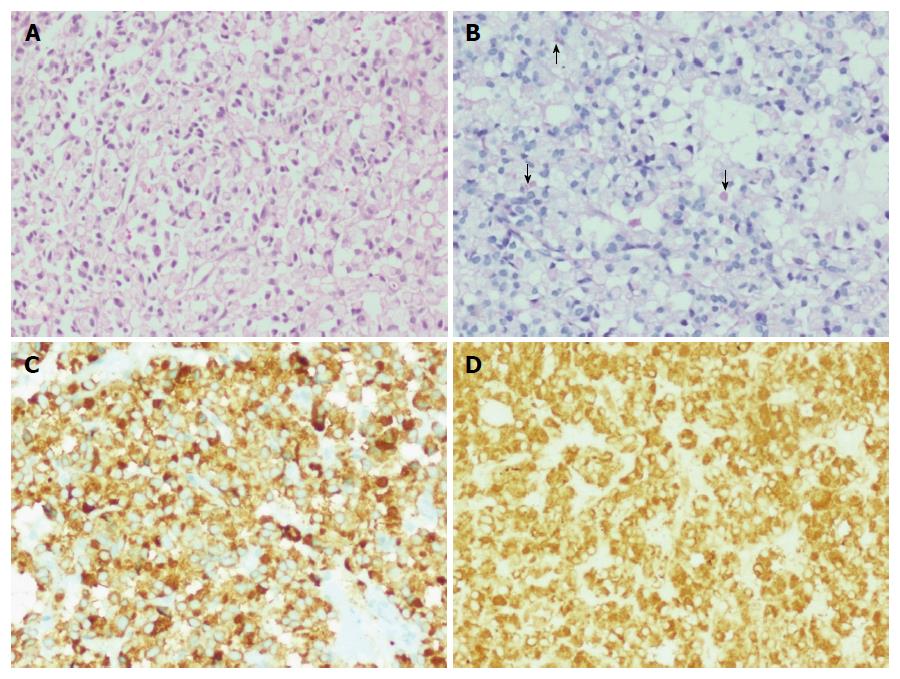
Figure 4 Signet ring cell neuroendocrine neoplasm, G2.
A: Tumor cells arranged in sheets and composed of polygonal cells with abundant clear to vacuolated cytoplasm and eccentrically placed uniform nuclei (H&E × 200); B: Occasional tumor cells containing pale staining cytoplasmic mucin (arrows) (PAS-D × 200); C: Tumor cells displaying diffuse cytoplasmic positivity for synaptophysin (immunohistochemistry × 200); D: Tumor cells displaying diffuse cytoplasmic positivity for chromogranin (immunohistochemistry × 200).
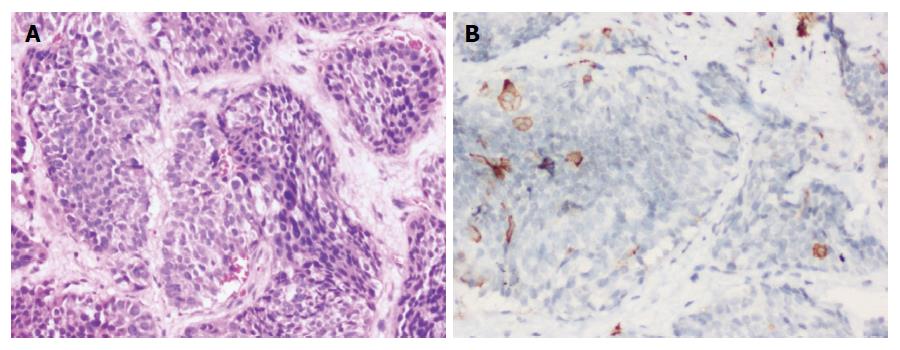
Figure 5 Adrenocorticotropic hormone producing neuroendocrine neoplasm, G2.
A - Tumor cells arranged in nests and islands. (H&E × 200); B: Occasional tumor cells displaying cytoplasmic positivity for adrenocorticotropic hormone (immunohistochemistry × 200).
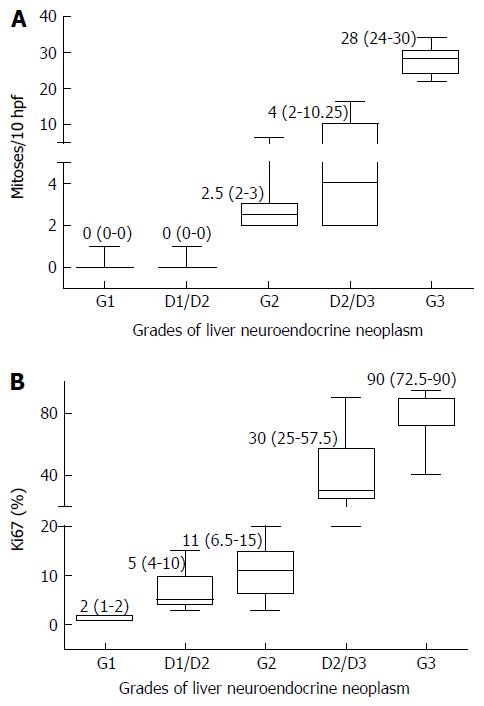
Figure 6 Correlation between the mitotic index and Ki67 index and the World Health Organization grading in liver neuroendocrine neoplasms.
A: Box-plot showing the median, interquartile range and range of the mitotic index for each World Health Organization (WHO) grade of tumor; B: Box-plot showing the median, interquartile range and range of the Ki67 index for each WHO grade of tumor.
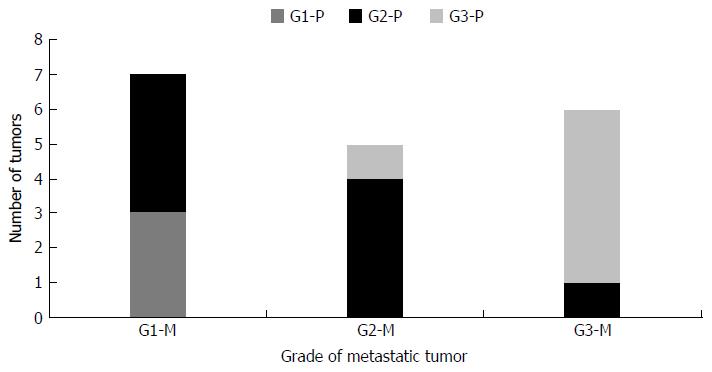
Figure 7 Shown here are tumor pairs in which the World Health Organization grade of the primary and metastatic tumors could be compared.
G1-P, G2-P and G3-P refer to the World Health Organization (WHO) grade of the primary tumor, while G1-M, G2-M and G3-M refer to WHO grade of the metastatic tumor.
- Citation: Burad DK, Kodiatte TA, Rajeeb SM, Goel A, Eapen CE, Ramakrishna B. Neuroendocrine neoplasms of liver - A 5-year retrospective clinico-pathological study applying World Health Organization 2010 classification. World J Gastroenterol 2016; 22(40): 8956-8966
- URL: https://www.wjgnet.com/1007-9327/full/v22/i40/8956.htm
- DOI: https://dx.doi.org/10.3748/wjg.v22.i40.8956


