Copyright
©The Author(s) 2016.
World J Gastroenterol. Oct 21, 2016; 22(39): 8831-8843
Published online Oct 21, 2016. doi: 10.3748/wjg.v22.i39.8831
Published online Oct 21, 2016. doi: 10.3748/wjg.v22.i39.8831
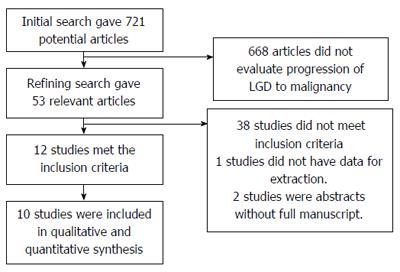
Figure 1 Flow diagram: Search results.
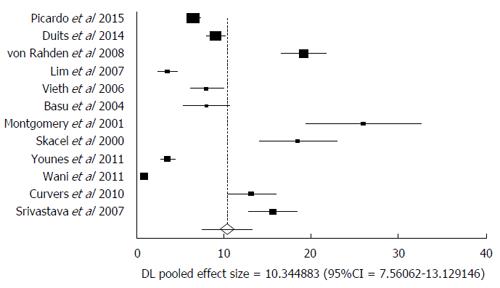
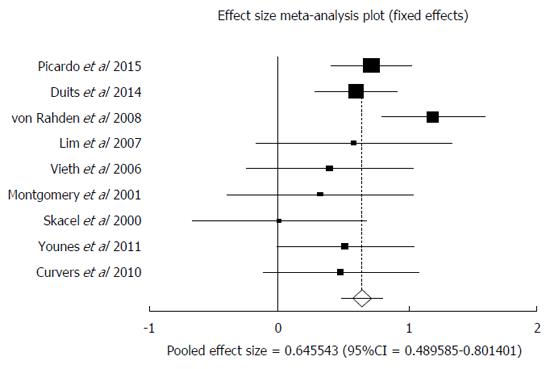
Figure 2 Forest plot representing the pooled and individual annual incidence rate for malignant (high grade dysplasia and/or esophageal adenocarcinoma) transformation in confirmed low grade dysplasia patients.
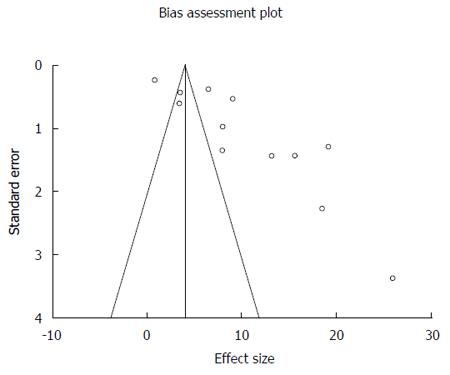
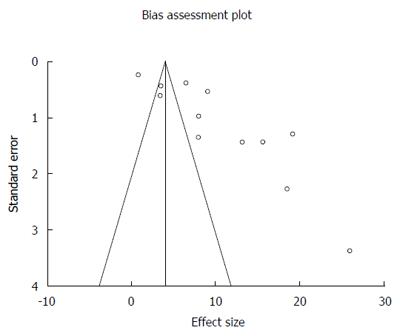
Figure 3 Funnel plot assessing for publication bias (annual incidence rate for malignant transformation in confirmed low grade dysplasia patients).
Figure 4 Forest plot representing the pooled and individual annual incidence rate for esophageal adenocarcinoma transformation in confirmed high grade dysplasia patients.
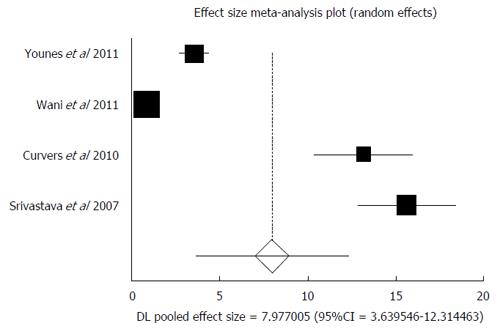
Figure 5 Forest plot representing the pooled and individual annual incidence rate for malignant (high grade dysplasia and/or esophageal adenocarcinoma) transformation in confirmed No dysplasia in Barrett’s esophagus patients.
Figure 6 Funnel plot assessing for publication bias (annual incidence rate for malignant transformation in confirmed No dysplasia in Barrett’s esophagus patients).
Figure 7 Forest plot representing the pooled and individual annual incidence rate for malignant (high grade dysplasia and/or esophageal adenocarcinoma) transformation in confirmed Indefinite for dysplasia in Barrett’s esophagus patients.
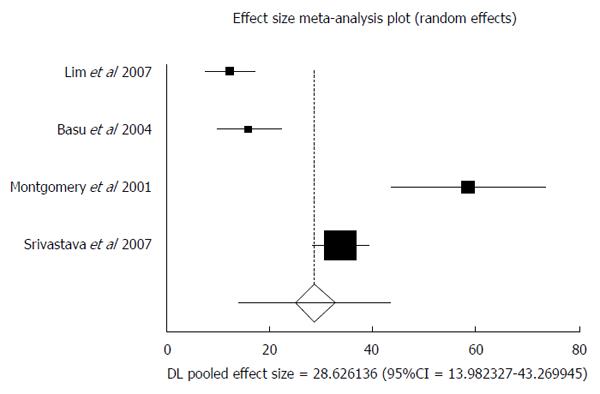
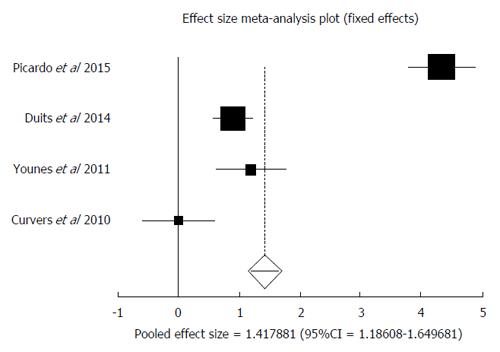
Figure 8 Forest plot representing the pooled and individual annual incidence rate for malignant (high grade dysplasia and/or esophageal adenocarcinoma) transformation in confirmed low grade dysplasia patients - Only prospective studies.
- Citation: Moole H, Patel J, Ahmed Z, Duvvuri A, Vennelaganti S, Moole V, Dharmapuri S, Boddireddy R, Yedama P, Bondalapati N, Uppu A, Vennelaganti P, Puli S. Progression from low-grade dysplasia to malignancy in patients with Barrett's esophagus diagnosed by two or more pathologists. World J Gastroenterol 2016; 22(39): 8831-8843
- URL: https://www.wjgnet.com/1007-9327/full/v22/i39/8831.htm
- DOI: https://dx.doi.org/10.3748/wjg.v22.i39.8831


