Copyright
©The Author(s) 2016.
World J Gastroenterol. Oct 7, 2016; 22(37): 8439-8446
Published online Oct 7, 2016. doi: 10.3748/wjg.v22.i37.8439
Published online Oct 7, 2016. doi: 10.3748/wjg.v22.i37.8439
Figure 1 Ultrasound findings.
A: Ultrasound revealed a 1.4 cm × 1.3 cm, well-defined cystic lesion (arrow) in the pancreatic body; B: A 6.8 cm sized strong echo (arrow) was shown in the gallbladder.
Figure 2 Computed tomography findings.
A: An unenhanced CT scan showed a 1.6 cm × 1.1 cm well-defined hypodense mass (arrow) in the pancreatic body; B: On the contrast-enhanced CT, the mass (arrow) was not enhanced. CT: Computed tomography.
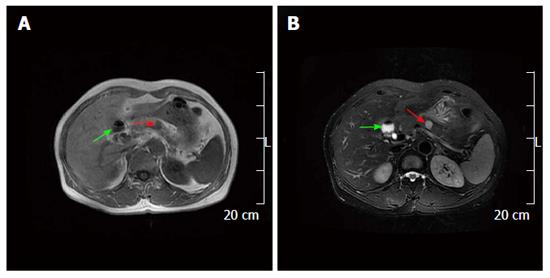
Figure 3 Magnetic resonance imaging findings.
A: The mass in the pancreatic body (red arrow) and gallbladder (green arrow) appeared hypointense on T1 weighted images; B: The mass in the pancreatic body (red arrow) appeared inhomogeneously hyperintense and the enlarged gallbladder (green arrow) appeared hyperintense on T2 weighted images.
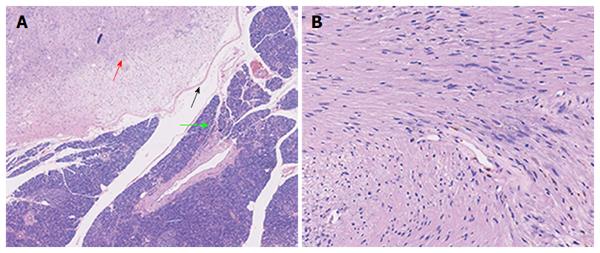
Figure 4 Microscopic examination.
A: A thin capsule (black arrow) was found between the tumor (red arrow) and pancreatic (green arrow) tissues (HE, 40 ×). B: The tumor was mainly composed of spindle-shaped cells with palisading arrangement and no atypia, which is consistent with a benign schwannoma. Both hypercellular and hypocellular areas were visible (HE, 200 ×). HE: Hematoxylin and eosin.
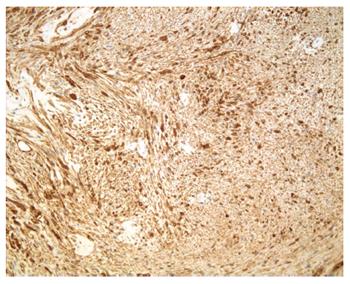
Figure 5 Immunohistochemical staining.
The tumor revealed strongly positive staining for S-100 (HE, 200 ×). HE: Hematoxylin and eosin.
- Citation: Xu SY, Sun K, Owusu-Ansah KG, Xie HY, Zhou L, Zheng SS, Wang WL. Central pancreatectomy for pancreatic schwannoma: A case report and literature review. World J Gastroenterol 2016; 22(37): 8439-8446
- URL: https://www.wjgnet.com/1007-9327/full/v22/i37/8439.htm
- DOI: https://dx.doi.org/10.3748/wjg.v22.i37.8439


