Copyright
©The Author(s) 2016.
World J Gastroenterol. Aug 28, 2016; 22(32): 7353-7364
Published online Aug 28, 2016. doi: 10.3748/wjg.v22.i32.7353
Published online Aug 28, 2016. doi: 10.3748/wjg.v22.i32.7353
Figure 1 Caloric intake, body weight, visceral fat index, and liver index in rats.
A: Mean caloric intake; B: Body weight at different experimental periods; C: Body weight at 12 wk; D: Visceral fat index, calculated as visceral fat weight/body weight; E: Liver index, calculated as liver weight/body weight. Differences were denoted as follows: aP < 0.05 vs CON group rats, cP < 0.05 vs FFAT group rats, eP < 0.05 vs RFAT group rats, gP < 0.05 vs restrictive high-sugar diet (RSUG) group rats.
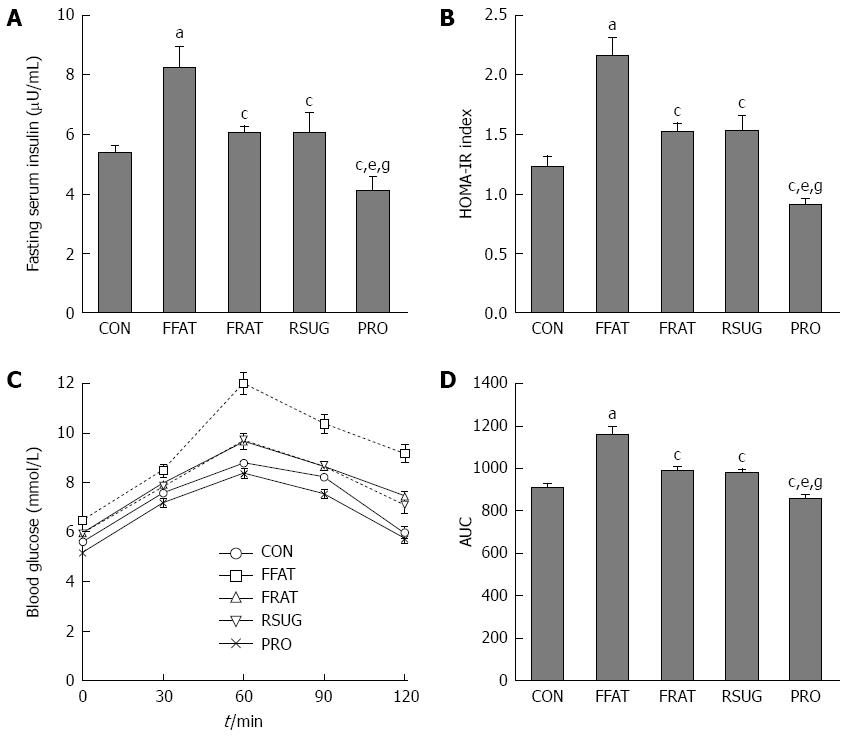
Figure 2 Fasting serum insulin, insulin resistance, and oral glucose tolerance test in rats.
A: Fasting serum insulin; B: HOMA-IR, calculated according to the formula fasting insulin (μU/mL) × fasting glucose (mmol/L)/22.5; C: Oral glucose tolerance test (OGTT); D: Area under the curve (AUC) of OGTT. Differences were denoted as follows: aP < 0.05 vs CON group rats, cP < 0.05 vs free high-fat diet (FFAT) group rats, eP < 0.05 vs RFAT group rats, gP < 0.05 vs restrictive high-sugar diet (RSUG) group rats.
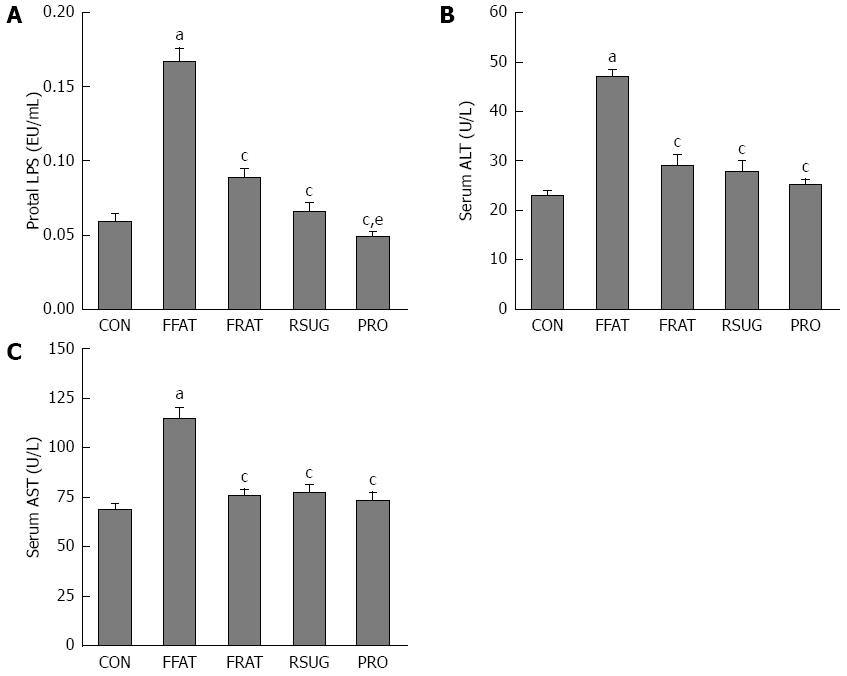
Figure 3 Portal lipopolysaccharide and liver function in rats.
A: Portal LPS; B: Serum ALT; C: Serum AST. Values are expressed as mean ± SE. Differences were denoted as follows: aP < 0.05 vs CON group rats, cP < 0.05 vs FFAT group rats, eP < 0.05 vs RFAT group rats. LPS: Lipopolysaccharide; ALT: Alanine aminotransferase; AST: Aspartate aminotransferase.
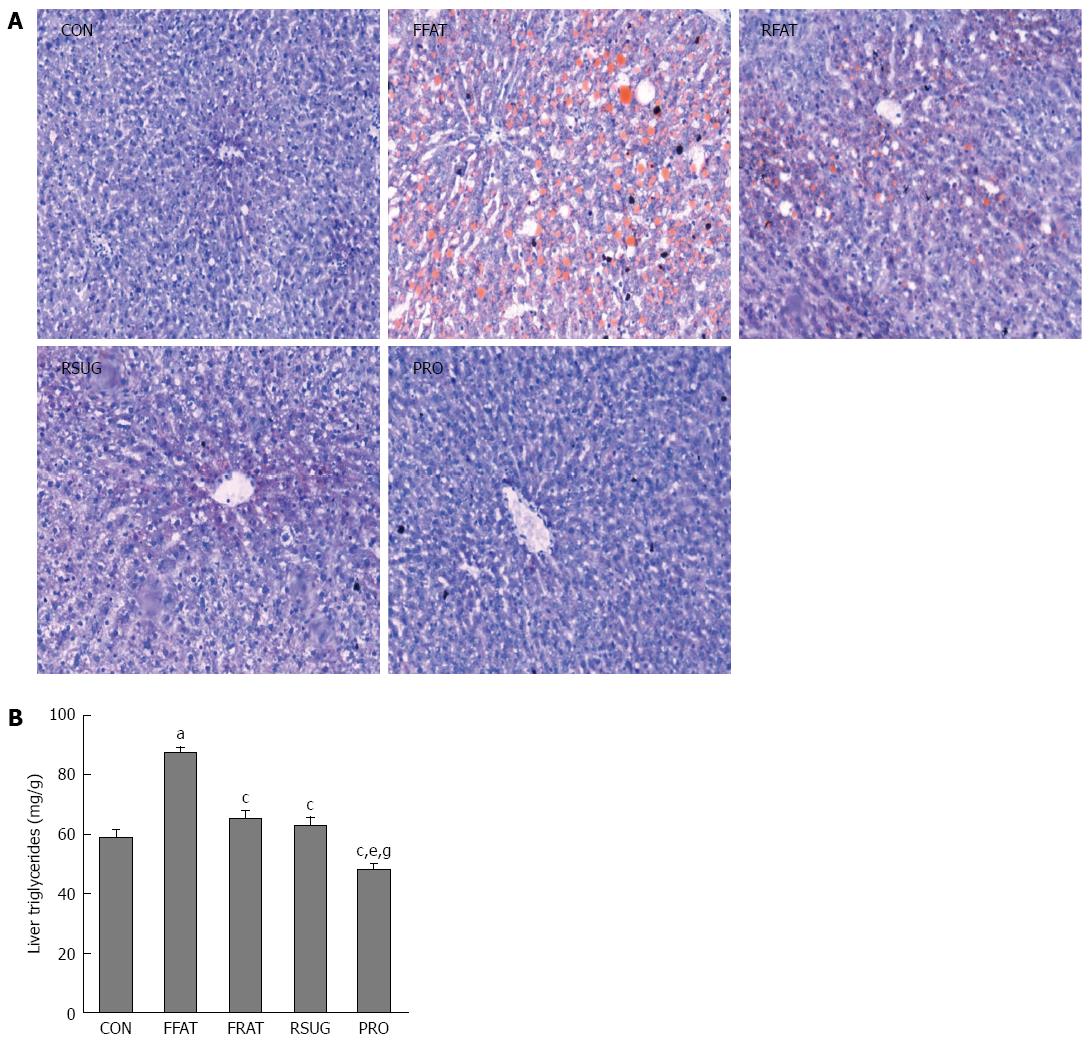
Figure 4 Liver triglycerides in rats.
A: Liver sections stained with oil red O; representative photomicrographs were captured at magnification × 200; B: Liver triglycerides. Differences were denoted as follows: aP < 0.05 vs CON group rats, cP < 0.05 vs FFAT group rats, eP < 0.05 vs RFAT group rats, gP < 0.05 vs RSUG group rats. CON: Control diet; FFAT: Free high-fat diet; RSUG: Restrictive high-sugar diet; RFAT: Restrictive high-fat diet.
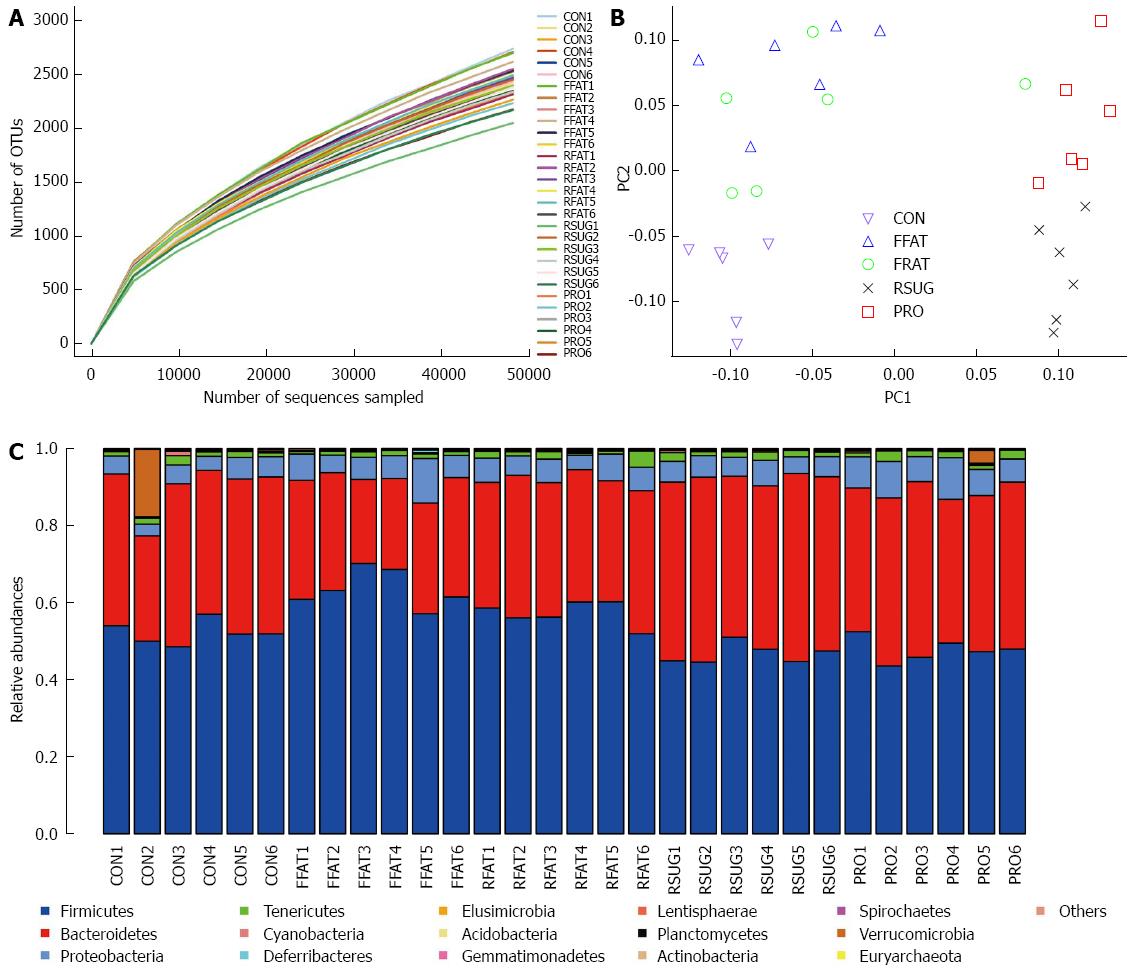
Figure 5 Bacterial composition of different group samples.
A: Rarefaction curves (at a 97% similarity level); B: Unweighted UniFrac PCoA; C: Intestinal microbiota composition at the phylum level. FFAT: Free high-fat diet; RSUG: Restrictive high-sugar diet; RFAT: Restrictive high-fat diet; CON: Control diet.
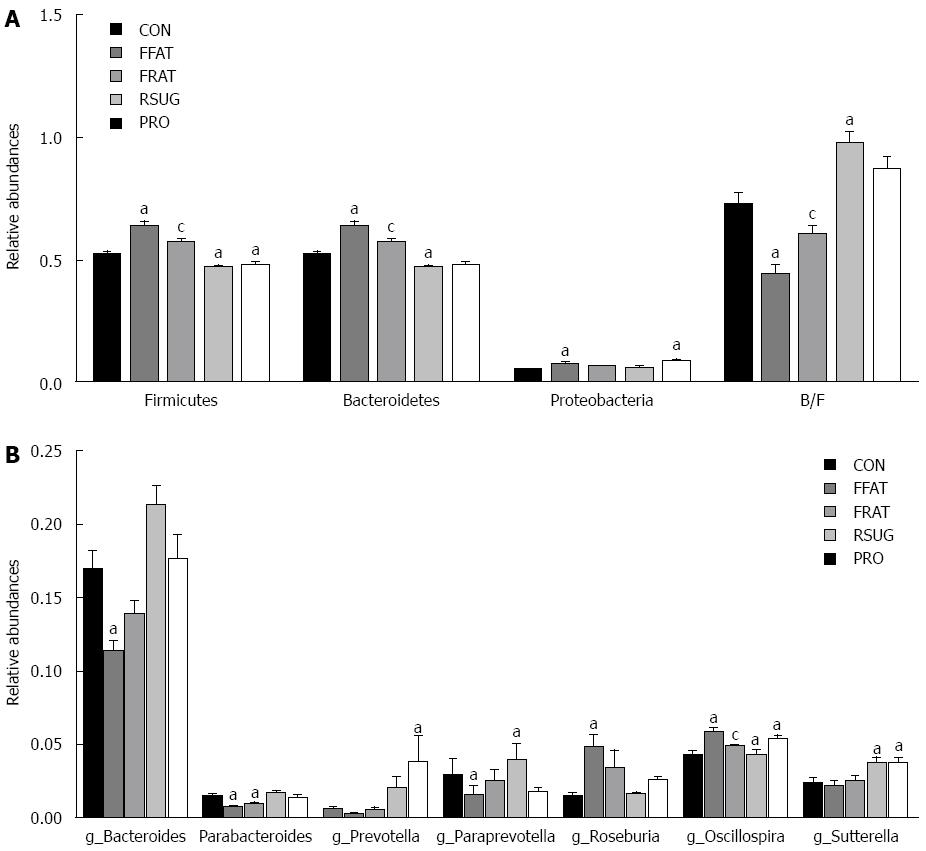
Figure 6 Comparison of relative abundance at the phylum and genus levels.
A: Comparison of relative abundance at the phylum level; B: Comparison of relative abundance at the genus level. aP < 0.05 vs CON group rats; cP < 0.05, FFAT group rats vs RFAT group rats. B/F: Ratio of Bacteroidetes to Firmicutes; FFAT: Free high-fat diet; RSUG: Restrictive high-sugar diet; RFAT: Restrictive high-fat diet; CON: Control diet.
- Citation: Liu JP, Zou WL, Chen SJ, Wei HY, Yin YN, Zou YY, Lu FG. Effects of different diets on intestinal microbiota and nonalcoholic fatty liver disease development. World J Gastroenterol 2016; 22(32): 7353-7364
- URL: https://www.wjgnet.com/1007-9327/full/v22/i32/7353.htm
- DOI: https://dx.doi.org/10.3748/wjg.v22.i32.7353


