Copyright
©The Author(s) 2016.
World J Gastroenterol. Aug 21, 2016; 22(31): 7124-7134
Published online Aug 21, 2016. doi: 10.3748/wjg.v22.i31.7124
Published online Aug 21, 2016. doi: 10.3748/wjg.v22.i31.7124
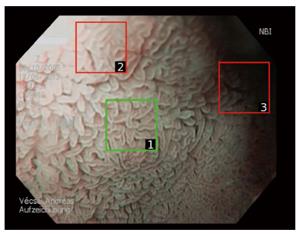
Figure 1 Manual patch selection: The original image contains ideal regions (e.
g., patch 1) but also over-exposed, blurry (patch 2) and under-exposed (patch 3) areas. Patches such as patch 2 or 3 have not been extracted for classification due to the high degree of degradation.
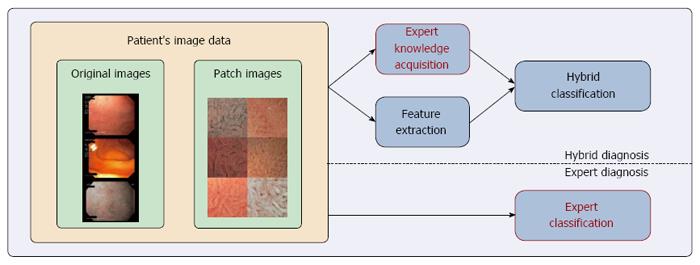
Figure 2 The general scheme of hybrid celiac disease diagnosis.
Image data is used for expert knowledge acquisition and feature extraction (which can be done in parallel), and finally, the output of these two stages is used by the hybrid classification stage.
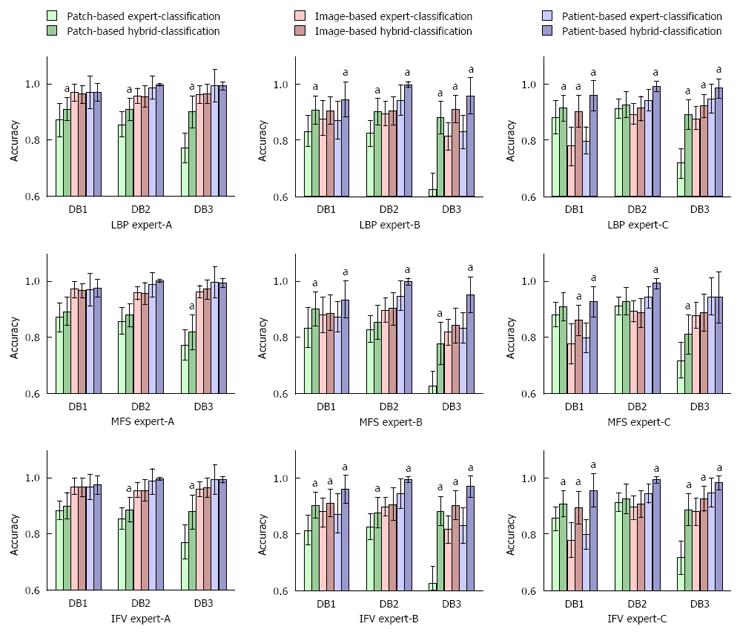
Figure 3 Mean accuracies and standard deviations of hybrid diagnosis vs expert diagnosis.
For each combination (expert, image representation and data set), the three hybrid classification approaches are compared with expert-based classification. aP < 0.05 between two approaches based on the same data. LBP: Local binary patterns; MFS: Multi-fractal spectrum; IFV: Improved Fisher vectors.
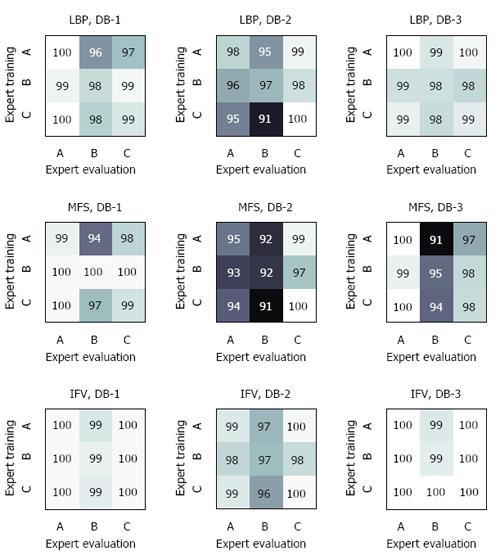
Figure 4 Can we transfer a model trained with one medical expert to another medical expert? In this figure, each cell indicates the accuracy (relative percentage compared to the best combination) that is obtained if training is performed with one and evaluation is performed with another expert (in the case of patch-based classification).
The rates on the diagonal line are obtained if training and evaluation is performed with the same expert. LBP: Local binary patterns; MFS: Multi-fractal spectrum; IFV: Improved Fisher vectors.
- Citation: Gadermayr M, Kogler H, Karla M, Merhof D, Uhl A, Vécsei A. Computer-aided texture analysis combined with experts' knowledge: Improving endoscopic celiac disease diagnosis. World J Gastroenterol 2016; 22(31): 7124-7134
- URL: https://www.wjgnet.com/1007-9327/full/v22/i31/7124.htm
- DOI: https://dx.doi.org/10.3748/wjg.v22.i31.7124


