Copyright
©The Author(s) 2016.
World J Gastroenterol. Aug 7, 2016; 22(29): 6690-6705
Published online Aug 7, 2016. doi: 10.3748/wjg.v22.i29.6690
Published online Aug 7, 2016. doi: 10.3748/wjg.v22.i29.6690
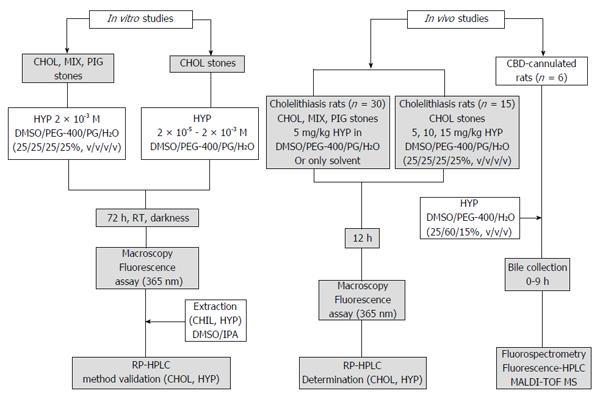
Figure 1 Flowchart of the experimental procedures.
CBD: Common bile duct; CHOL: Cholesterol; DMSO: Dimethyl sulfoxide; HYP: Hypericin; IPA: 2-propanol; PEG: Polyethylene glycol; PG: Propylene glycol; RP-HPLC: Reverse phase-high performance liquid chromatography; MALDI-TOF MS: Matrix-assisted laser desorption-ionization time-of-flight mass spectrometry; MIX: Mixed; PIG: Pigment; RT: Room temperature.
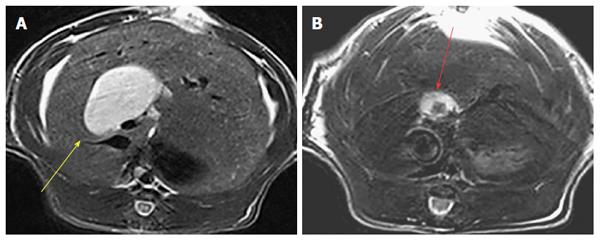
Figure 2 Transverse T2 weighted MR scanning images in a rat model of cholestasis-induced virtual gallbladder (yellow arrow) before (A) and after (B) implantation of a human gallstone (red arrow).
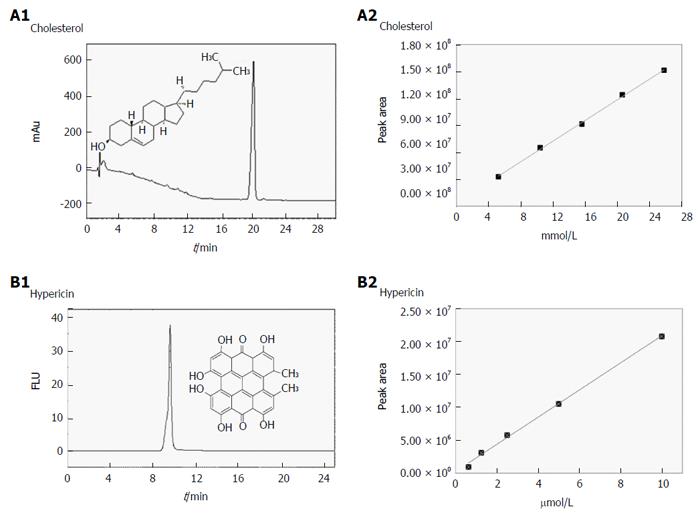
Figure 3 Validation of the chromatographic methods for cholesterol and hypericin quantification in gallstones.
A1-B2: Validation data of the analysis by reverse phase-high performance liquid chromatography on hypericin pre-incubated human gallstones with UV (204 nm) and fluorescence detection (excitation/emission wavelengths: 470/600 nm). A typical UV chromatogram of 5.2 × 10⁻³ M cholesterol with a retention time (RT) of 19 ± 0.22 min (A1) and the HPLC-generated calibration curve (A2) based on four replicate measurements of five working solutions of cholesterol are presented. A representative fluorescence chromatogram of 1.3 × 10⁻⁶ M hypericin with an RT of 9.68 ± 0.06 min (B1) along with corresponding HPLC-generated calibration curve of hypericin (B2) is shown. FLU: Fluorescence units; mAu: Milli-absorbance units.
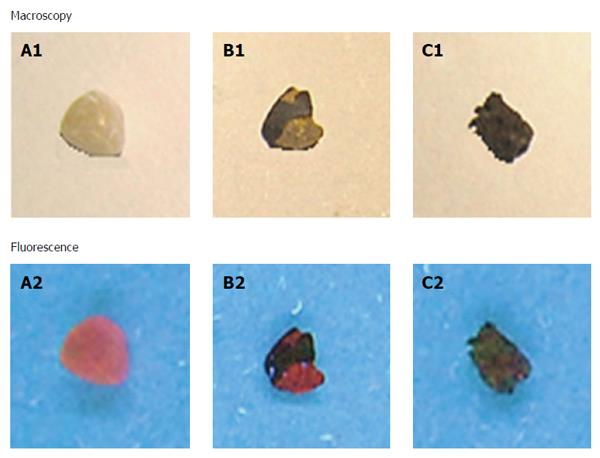
Figure 4 Macroscopy and fluorescence observations of hypericin-treated human gallstones under white and UV (365 nm) lights.
A yellow cholesterol stone (A1) showed homogeneous and red fluorescence on the surface (A2). A mixed stone with yellowish and brown patches (B1) revealed red fluorescence solely on the yellow cholesterol region (B2). A pigment stone appeared dark brown (C1) with almost no fluorescence (C2).
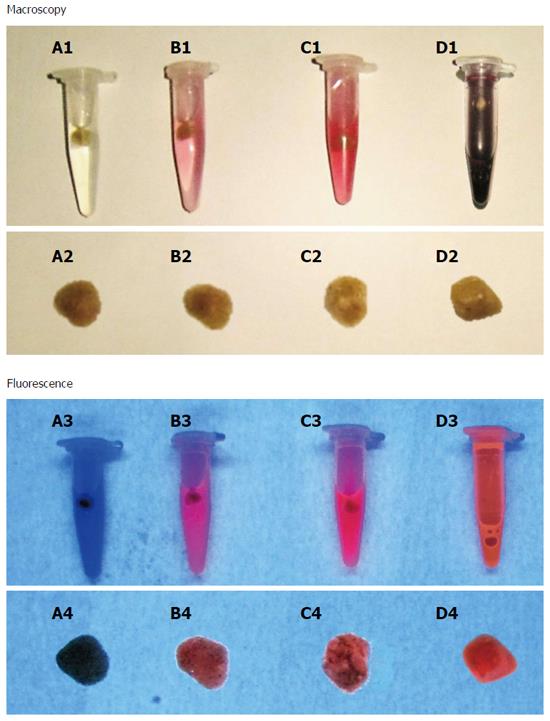
Figure 5 Macroscopic digital imaging under white and UV (365 nm) lights of human cholesterol gallstones treated with different concentrations of hypericin (2 × 10⁻⁵ - 2 × 10⁻³ M) or only with solvent for 72 h.
Solvent-treated stone (A1, A2) lacked fluorescence (A3, A4). Gallstones pre-incubated with hypericin solutions at 2 × 10⁻⁵ M (B1, B2), 2 × 10⁻⁴ M (C1, C2) and 2 × 10⁻³ M (D1, D2) exhibited fluorescence (B4, C4, D4), which seemed to increase with the hypericin concentration (B3, C3, D3).
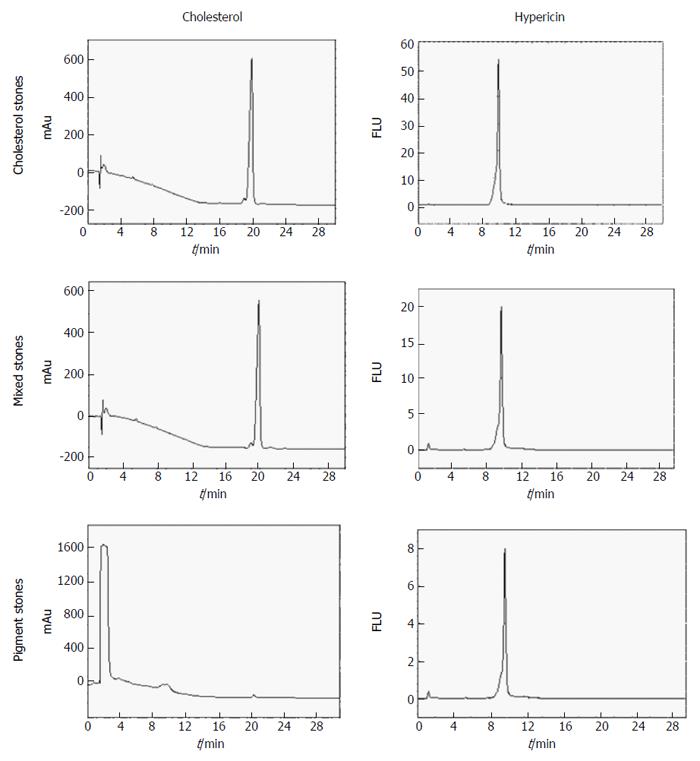
Figure 6 HPLC chromatograms of dimethyl sulfoxide/2-propanol (50%:50%, v/v) extracts from hypericin pre-incubated gallstones with UV (204 nm) and fluorescence detection (excitation/emission wavelengths: 470/600 nm).
Under UV, cholesterol and mixed stone extracts showed a main peak with a retention time (RT) of 19.99 ± 0.17 min corresponding to cholesterol. With fluorescence detection, a single peak of hypericin at 9.68 ± 0.06 min was observed. In pigment stone extracts, the UV showed a large peak at 1.41 ± 0.02 min representing other non-cholesterol components in this type of stone. The second small peak with an RT of 19.81 ± 0.11 min corresponding to cholesterol was also observed. Under fluorescence, pigment stone extracts showed a smaller peak of hypericin than that in cholesterol and mixed stones. FLU: Fluorescence units; mAu: Milli-absorbance units; HPLC: High performance liquid chromatography.
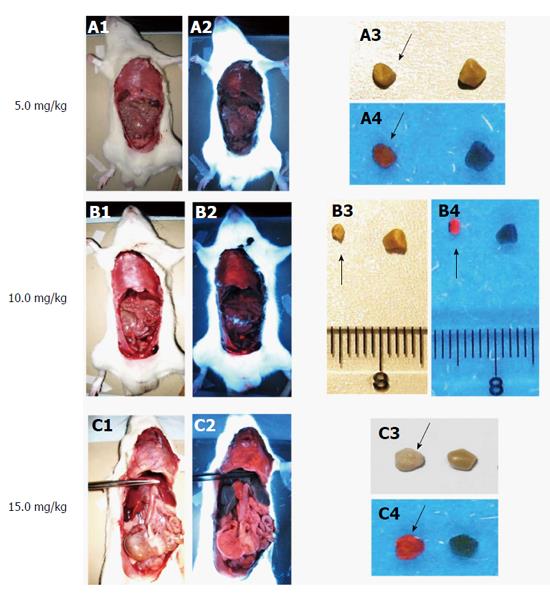
Figure 7 Macroscopic digital imaging under white and UV (365 nm) lights in rats of cholelithiasis receiving intravenous 1 × 10⁻³ M hypericin at 5, 10, 15 mg/kg and their corresponding extracted gallstones.
Rats receiving hypericin at 5 mg/kg (A1) exhibited almost no fluorescence in organs (A2). The extracted gallstones (black arrow) showed faint fluorescent relative to control stones (A3, A4). With 10 mg/kg hypericin (B1), moderate fluorescence appeared in the diaphragm (B2). Higher red fluorescence in gallstones (black arrow) was observed as compared to control stone (B3, B4). Rats treated with 15 mg/kg hypericin (C1) revealed high fluorescence in visceral organs (C2). The stone (black arrow) displayed high fluorescence as compared to the control (C3, C4).
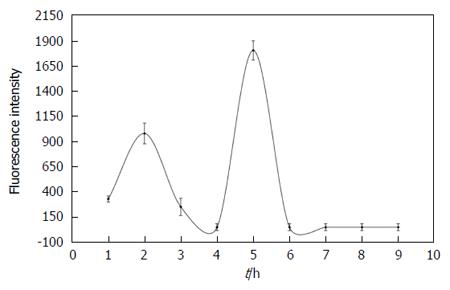
Figure 8 Nine-hour time-concentration curve of fluorescent species in bile from CBD-cannulated rats having received 1 × 10⁻³ M hypericin at 10 mg/kg.
Two peaks accounting for 20% of the administered dose were found at 2 h and 5 h, suggesting enterohepatic circulation.
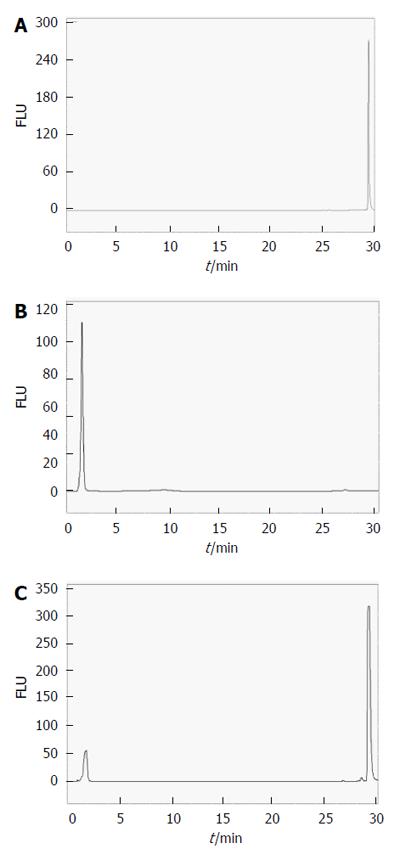
Figure 9 HPLC chromatograms with fluorescence detection of 1.
3 × 10⁻⁵ M hypericin eluting at an RT of 29.22 min (A), bile alone with an RT of 1.67 min (B) and 1.3 × 10⁻⁵ M hypericin in bile (C) with two above peaks (A, B) observed. FLU: Fluorescence units; HPLC: High performance liquid chromatography.
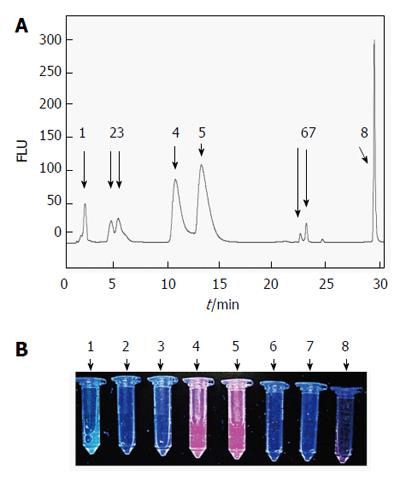
Figure 10 A typical HPLC chromatogram with fluorescence detection of hypericin and its conjugated metabolites in bile from CBD-cannulated rats at 2 h after hypericin administration.
Eight fluorescent peaks were observed. The peak at 1.76 min corresponded to the autofluorescence of the bile. The following six peaks with RT of 4.27, 5.03, 10.42, 12.95, 22.50 and 23.16 min appeared to represent hypericin in conjugated or metabolized forms. The last peak seemed to be unchanged hypericin eluting at 29.12 min (A). Spectrometry measurements of HPLC peaks confirmed the highest fluorescent signals from those with RT of 1.76, 10.42, 12.95 and 29.12 min (B). FLU: Fluorescence units; HPLC: High performance liquid chromatography.
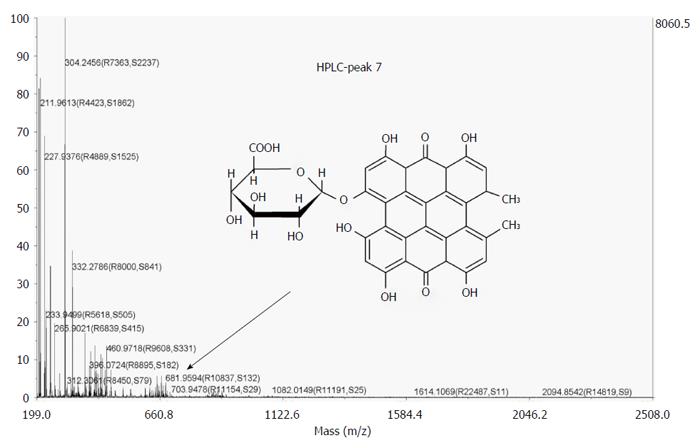
Figure 11 MALDI TOF-TOF MS spectra of the HPLC-collected peak with an RT of 23.
16 min which was isolated from bile of CBD-cannulated rats after administration of hypericin. A peak at m/z = 681.9594 Da could be identified (arrow), representing the mono-glucuronide ion of hypericin. CBD: Common bile duct.
- Citation: Miranda Cona M, Liu YW, Hubert A, Yin T, Feng YB, de Witte P, Waelkens E, Jiang YS, Zhang J, Mulier S, Xia Q, Huang G, Oyen R, Ni YC. Differential diagnosis of gallstones by using hypericin as a fluorescent optical imaging agent. World J Gastroenterol 2016; 22(29): 6690-6705
- URL: https://www.wjgnet.com/1007-9327/full/v22/i29/6690.htm
- DOI: https://dx.doi.org/10.3748/wjg.v22.i29.6690


