Copyright
©The Author(s) 2016.
World J Gastroenterol. Jul 28, 2016; 22(28): 6509-6519
Published online Jul 28, 2016. doi: 10.3748/wjg.v22.i28.6509
Published online Jul 28, 2016. doi: 10.3748/wjg.v22.i28.6509
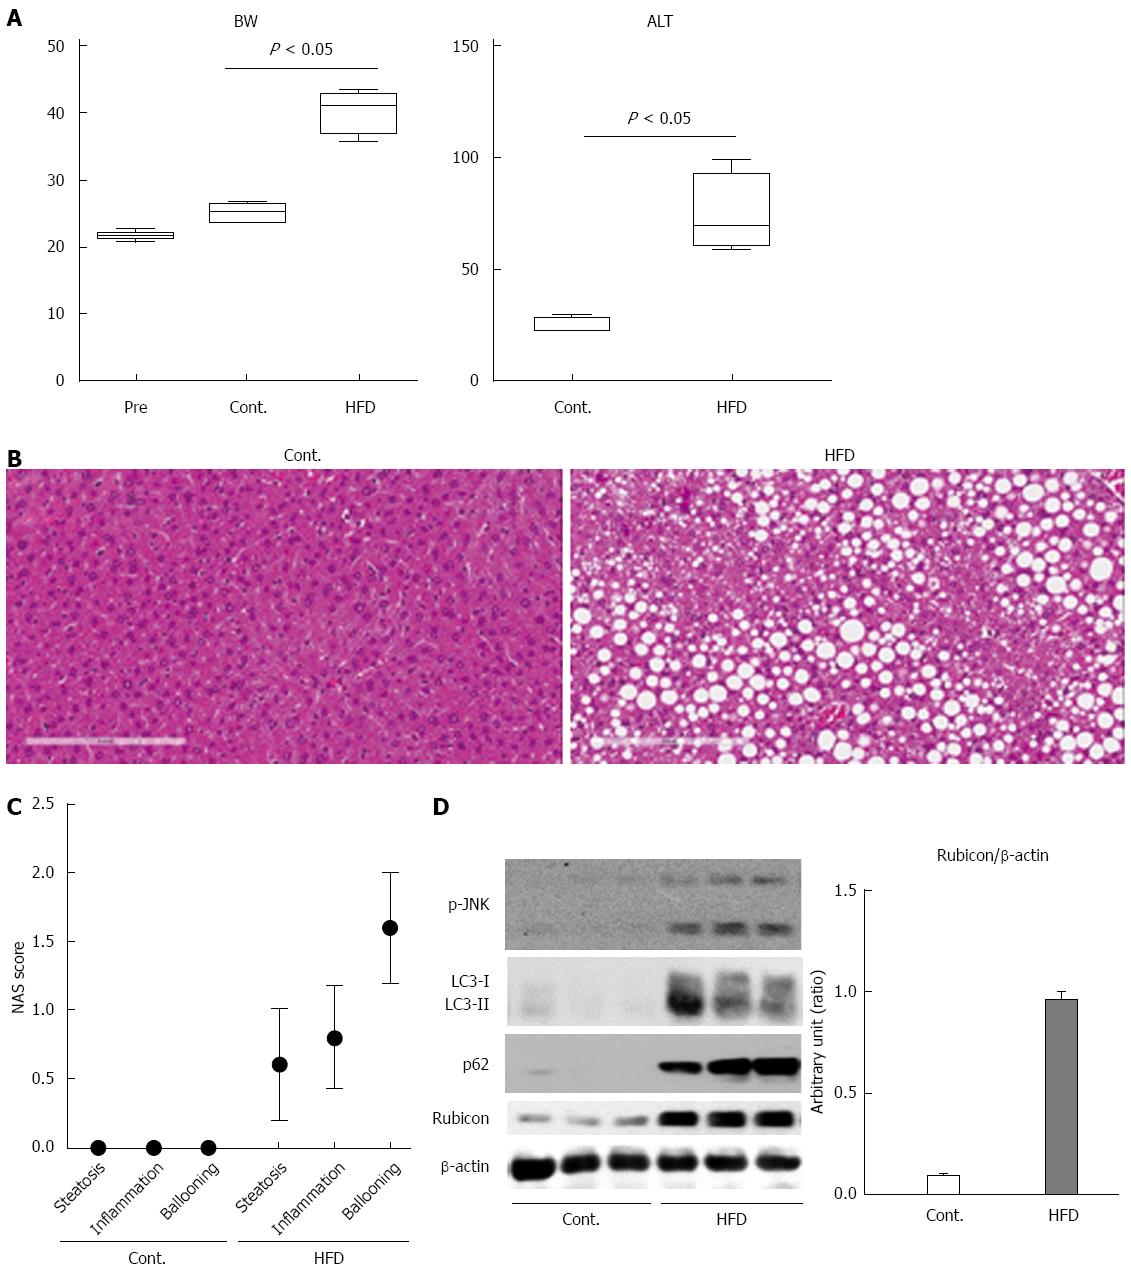
Figure 1 Mice fed high-fat diet show steatosis and inflammation of the liver, and impairment of the autophagic process.
A: The body weights of mice at the start of feeding or at 12 wk after feeding with normal chow (Cont.) or high-fat diet (HFD) are presented in the left panel. The serum ALT levels after 12 wk of feeding are shown in the right panel; B: Histology of the liver of control and HFD mice is shown in the left and the right panel, respectively (Hematoxylin and Eosin staining); C: Non-alcoholic steatohepatitis activity scores (NAS) of control and HFD mice; D: Immunoblotting analyses of phosphorylated JNK, p62, LC3, Rubicon, and β-actin. Protein samples were prepared from the liver tissue of each of the control and HFD mice. All of the above experiments were repeated three times and representative results are shown. The quantitative data are presented as the means ± SD.
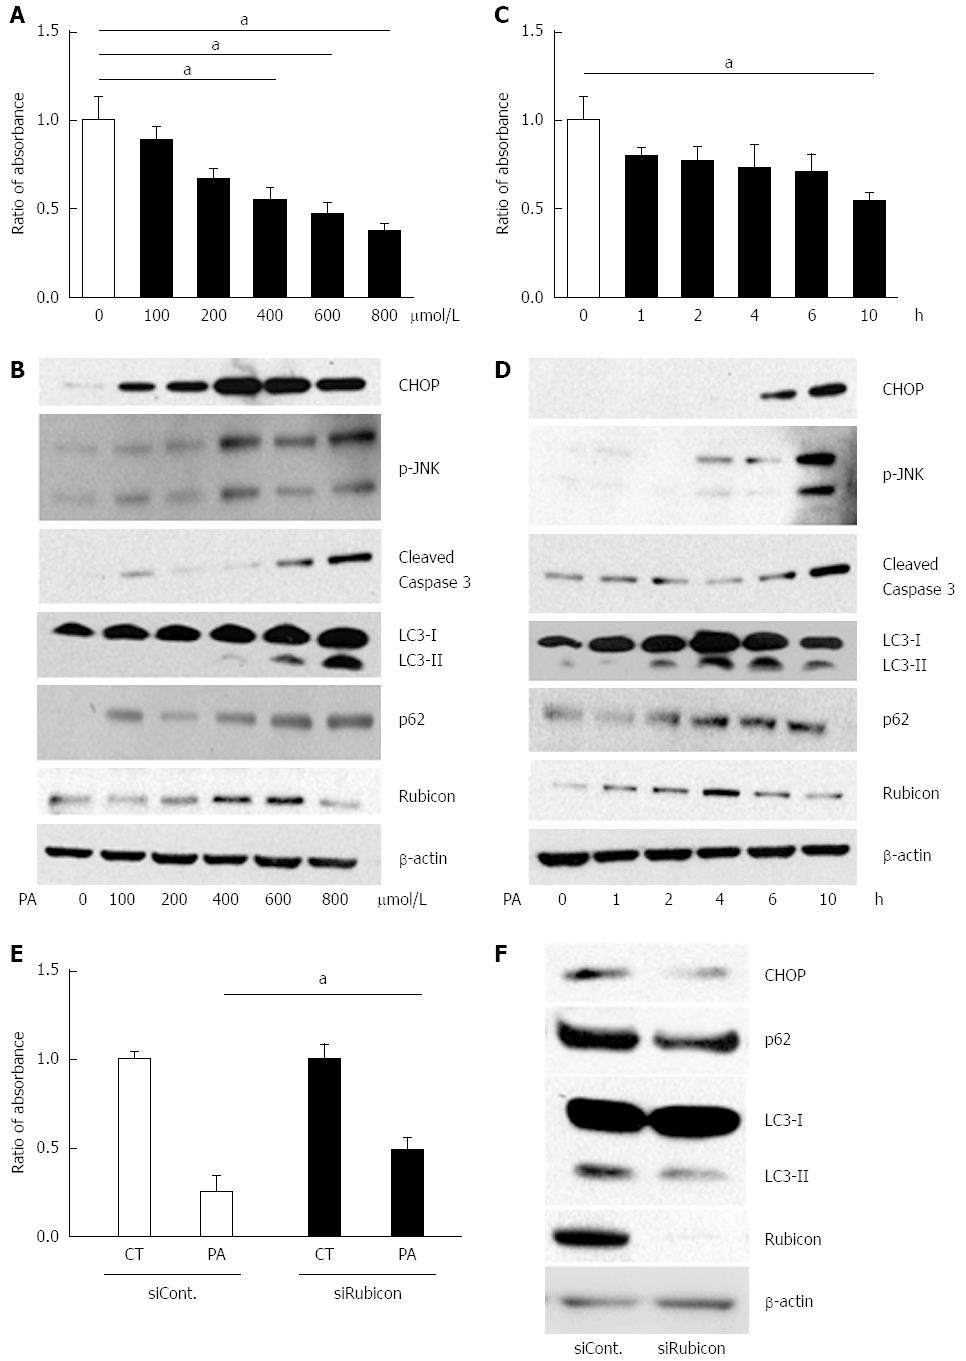
Figure 2 Treatment with palmitate induces apoptosis in a dose- and a time-dependent manner, and initiates but impairs the autophagic process in AML12 cells.
A and B: AML12 cells were incubated with PA at the indicated concentrations for 10 h. Untreated AML12 cells were used as the control. A: PA cytotoxicity as evaluated by cell proliferation assay. Living cells are presented as the ratio of absorbance of cells treated with indicated conditions to that of untreated AML12 cells; B: Immunoblotting analyses of CHOP, phosphorylated JNK, cleaved Caspase-3, LC3, p62, Rubicon, and actin. Whole cell lysates were prepared from AML12 cells incubated at the indicated concentrations for 10 h; C and D: AML12 cells were incubated with 800 μmol/L of PA for the indicated periods. Untreated AML12 cells (0 h) were used as the control; C: PA cytotoxicity as evaluated by cell proliferation assay. Living cells are presented as the ratio of absorbance at the indicated incubation time to the absorbance at 0 h; D: Whole cell lysate was prepared from the AML12 cells with 800 μmol/L PA for the indicated incubation times; E and F: AML12 cells were incubated with 800 μmol/L PA for 4 h after transfection with the indicated siRNA: control siRNA (siCont) or Rubicon siRNA (siRubicon); E: PA cytotoxicity as evaluated by cell proliferation assay. Living cells are presented as the ratio of absorbance in AML12 cells with 800 μmol/L PA for 10 h (PA) to that in AML12 control (CT) cells; F: Whole cell lysate was prepared from AML12 cells treated with 800 μmol/L PA with the indicated siRNA. All of the above experiments were repeated three times and representative results are shown. The quantitative data are presented as the mean ± SD; aP < 0.05.
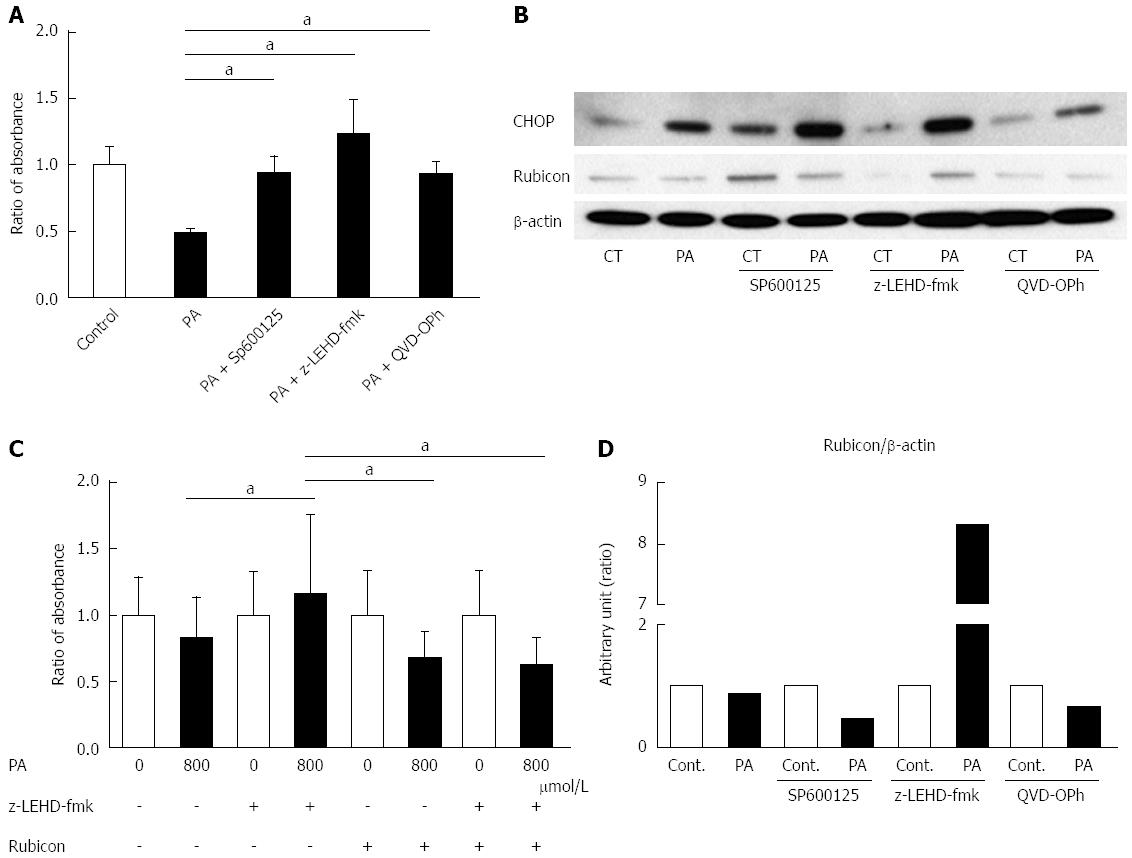
Figure 3 c-Jun N-terminal kinase inhibitor, Caspase-9 inhibitor, and Pan-Caspase inhibitor ameliorate palmitate-induced cell death, and Caspase-9 inhibition attenuates the decrease of Rubicon protein.
A: AML12 cells were incubated with 800 μmol/L PA for 10 h in the presence or absence of either 30 μmol/L SP600125, 20 μmol/L LEHD-fmk, or 20 μmol/L QVD-OPh. Untreated AML12 cells were used as the control. PA cytotoxicity was evaluated by cell proliferation assay. Living cells are presented as the ratio of the absorbance at the indicated conditions to that of AML12 without PA treatment; B: Whole cell lysates were prepared from AML12 cells treated with PA (800 μmol/L) for 10 h in the presence or absence of either 30 μmol/L SP600125, 20 μmol/L z-LEHD-fmk, or 20 μmol/L QVD-OPh. Immunoblot analysis of CHOP and Rubicon. β-actin was used as the loading control; C: The size of the AML12 cells after PA treatment (800 μmol/L) for 10 h was compared to that of untreated AML12 cells using the Image J software program. z-LEHD-fmk and/or siRubicon were used for Caspase-9 inhibition or Rubicon knockdown. The difference in cell size under each treatment condition is presented as the ratio to the cell size of the respective controls. All of the above experiments were repeated three times and representative results are shown. The quantitative data are presented as the mean ± SD; aP < 0.05.
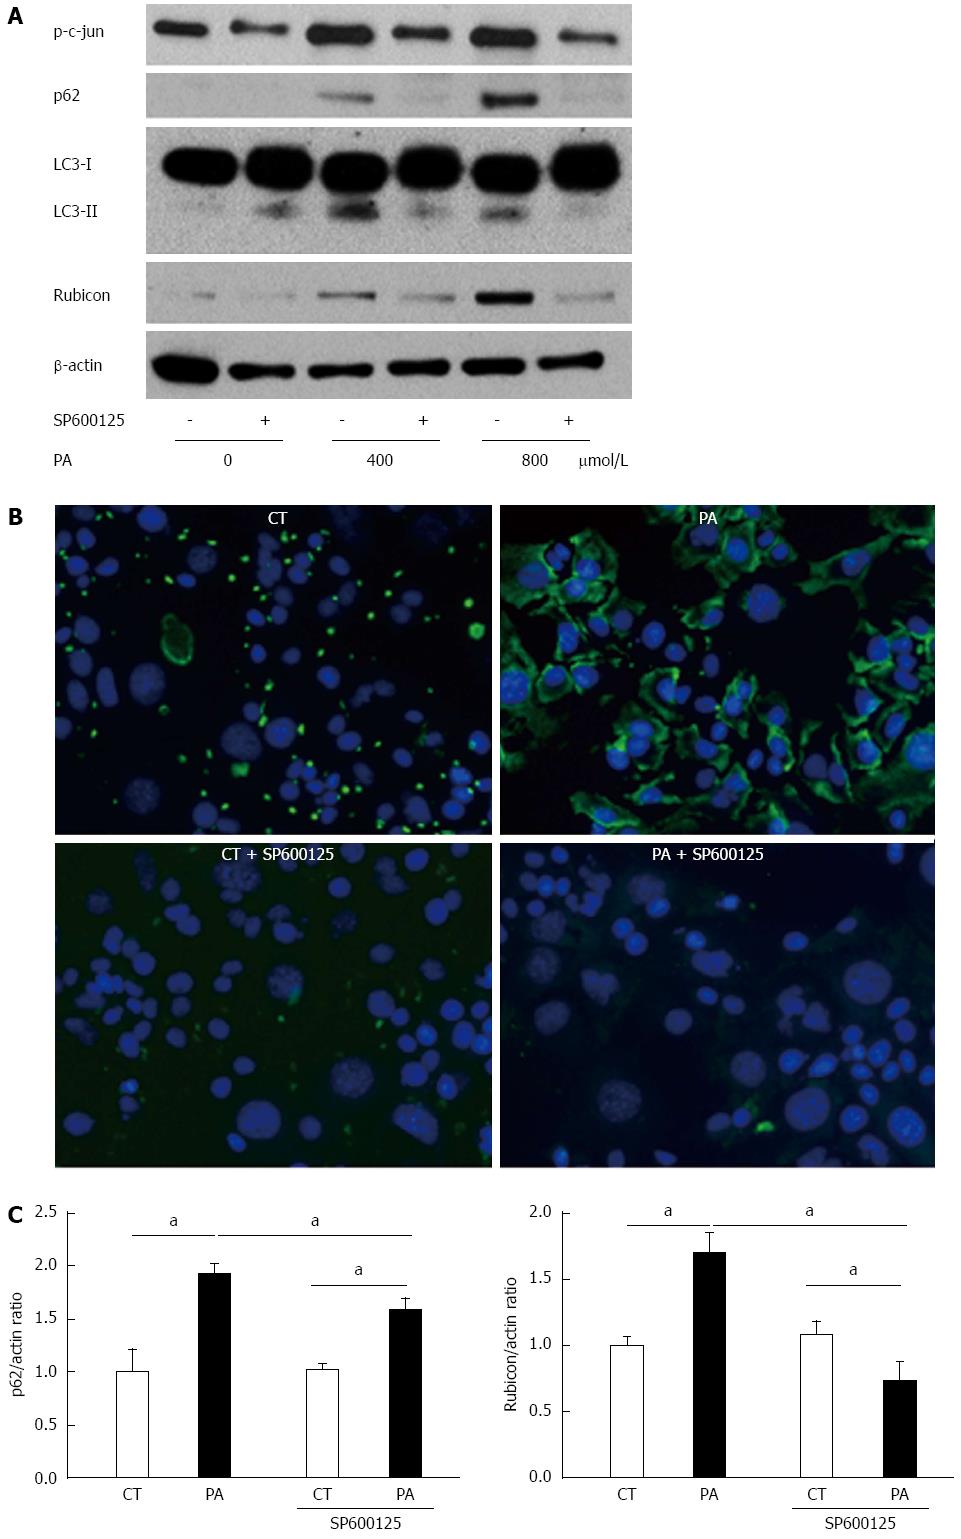
Figure 4 Palmitate induces expression of both p62 and Rubicon, and PA-induced Rubicon expression is mediated by c-Jun N-terminal kinase phosphorylation.
A: Whole cell lysates were prepared from AML12 cells treated with PA (400 or 800 μmol/L) for 4 h in the presence or absence of SP600125. Immunoblotting analyses were performed for p62, LC3, and Rubicon. β-actin was used as the loading control; B: AML12 cells were incubated with 800 μmol/L PA for 4 h in the presence or absence of 30 μmol/L SP600125. p62 antibody was used as the primary antibody, and Alexa Fluor® 488-labeled secondary antibody was used for detecting p62 antibody. Samples were visualized using an EVOS microscope; C: Total RNA was prepared from AML12 cells treated with PA (800 μmol/L) for 4 h in the presence or absence of 30 μmol/L SP600125. Vehicle-treated cells were used as the control (CT). Both p62 and Rubicon mRNA were quantified by RT-qPCR, normalized to Actin, and expressed as the fold-change vs control cells without SP600125. All of the above experiments were repeated three times and representative results are shown. The quantitative data are presented as the mean ± SD; aP < 0.05 vs control.
- Citation: Suzuki A, Kakisaka K, Suzuki Y, Wang T, Takikawa Y. c-Jun N-terminal kinase-mediated Rubicon expression enhances hepatocyte lipoapoptosis and promotes hepatocyte ballooning. World J Gastroenterol 2016; 22(28): 6509-6519
- URL: https://www.wjgnet.com/1007-9327/full/v22/i28/6509.htm
- DOI: https://dx.doi.org/10.3748/wjg.v22.i28.6509


