Copyright
©The Author(s) 2016.
World J Gastroenterol. Jul 14, 2016; 22(26): 6057-6064
Published online Jul 14, 2016. doi: 10.3748/wjg.v22.i26.6057
Published online Jul 14, 2016. doi: 10.3748/wjg.v22.i26.6057
Figure 1 Superb microvascular imaging vascular patterns.
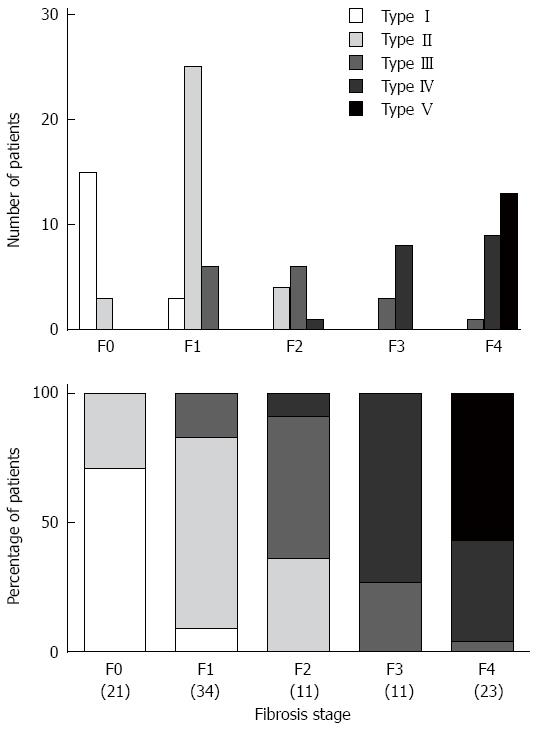
Type I, clearly defined vessels with no irregularities; Type II, poor ramification and tapering of the main branches; Type III, mild tortuosity of the main branches and uneven branching; Type IV, moderate tortuosity and mild grouping of the main branches; and Type V, severe tortuosity and grouping of the main branches.
Figure 2 Distribution of the superb microvascular imaging patterns and fibrosis stages.
Fisher’s exact probability test demonstrated a significant difference in the SMI pattern distribution and the fibrosis stage (P < 0.001). SMI: Superb microvascular imaging.
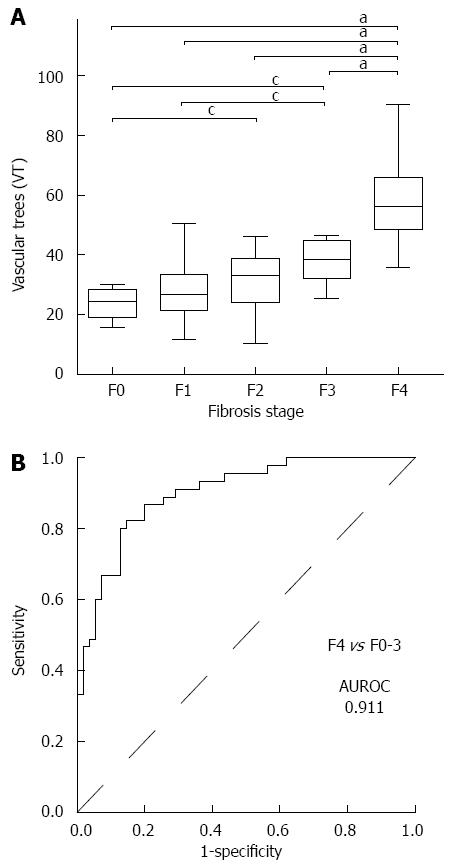
Figure 3 Vascular tree values for the different fibrosis stages in patients who underwent liver biopsy (A) and the receiver operating characteristic curve of the vascular tree for the prediction of F4 in all 100 patients.
The VT values increased in proportion to the fibrosis stage (aP < 0.001, cP < 0.01 by Kruskal-Wallis analysis). AUROC: Area under the receiver operating characteristic; VT: Vascular trees.
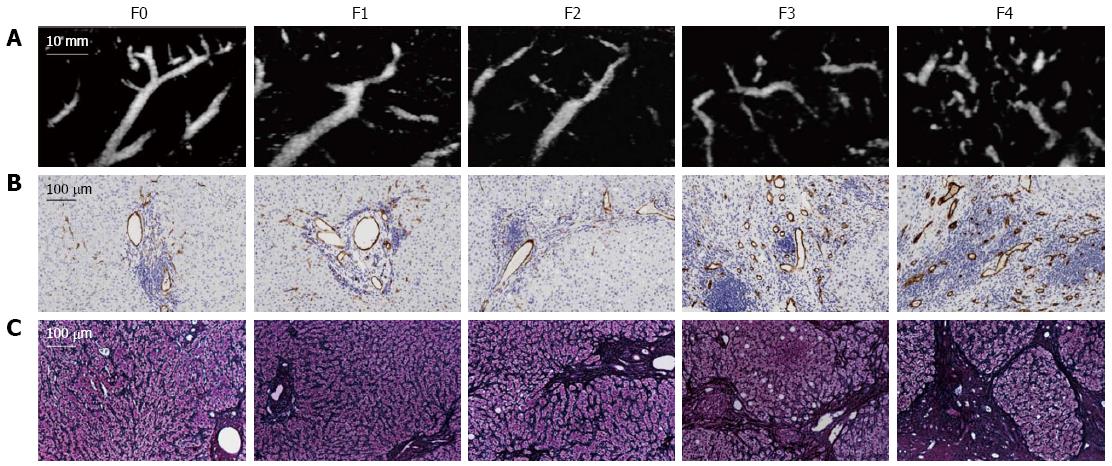
Figure 4 Superb microvascular imaging images and CD34 expressions at different fibrosis stages.
A: SMI image; B: CD34 expression; C: Gomori trichrome staining. SMI: superb microvascular imaging.
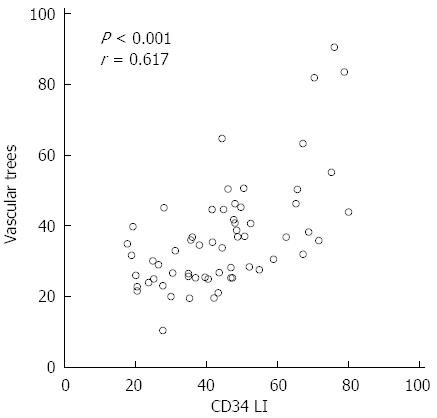
Figure 5 Correlation between the vascular trees value and the CD34 labeling index.
Spearman’s rank correlation coefficient. LI: Labeling index.
- Citation: Kuroda H, Abe T, Kakisaka K, Fujiwara Y, Yoshida Y, Miyasaka A, Ishida K, Ishida H, Sugai T, Takikawa Y. Visualizing the hepatic vascular architecture using superb microvascular imaging in patients with hepatitis C virus: A novel technique. World J Gastroenterol 2016; 22(26): 6057-6064
- URL: https://www.wjgnet.com/1007-9327/full/v22/i26/6057.htm
- DOI: https://dx.doi.org/10.3748/wjg.v22.i26.6057


