Copyright
©The Author(s) 2016.
World J Gastroenterol. Jul 14, 2016; 22(26): 6016-6026
Published online Jul 14, 2016. doi: 10.3748/wjg.v22.i26.6016
Published online Jul 14, 2016. doi: 10.3748/wjg.v22.i26.6016
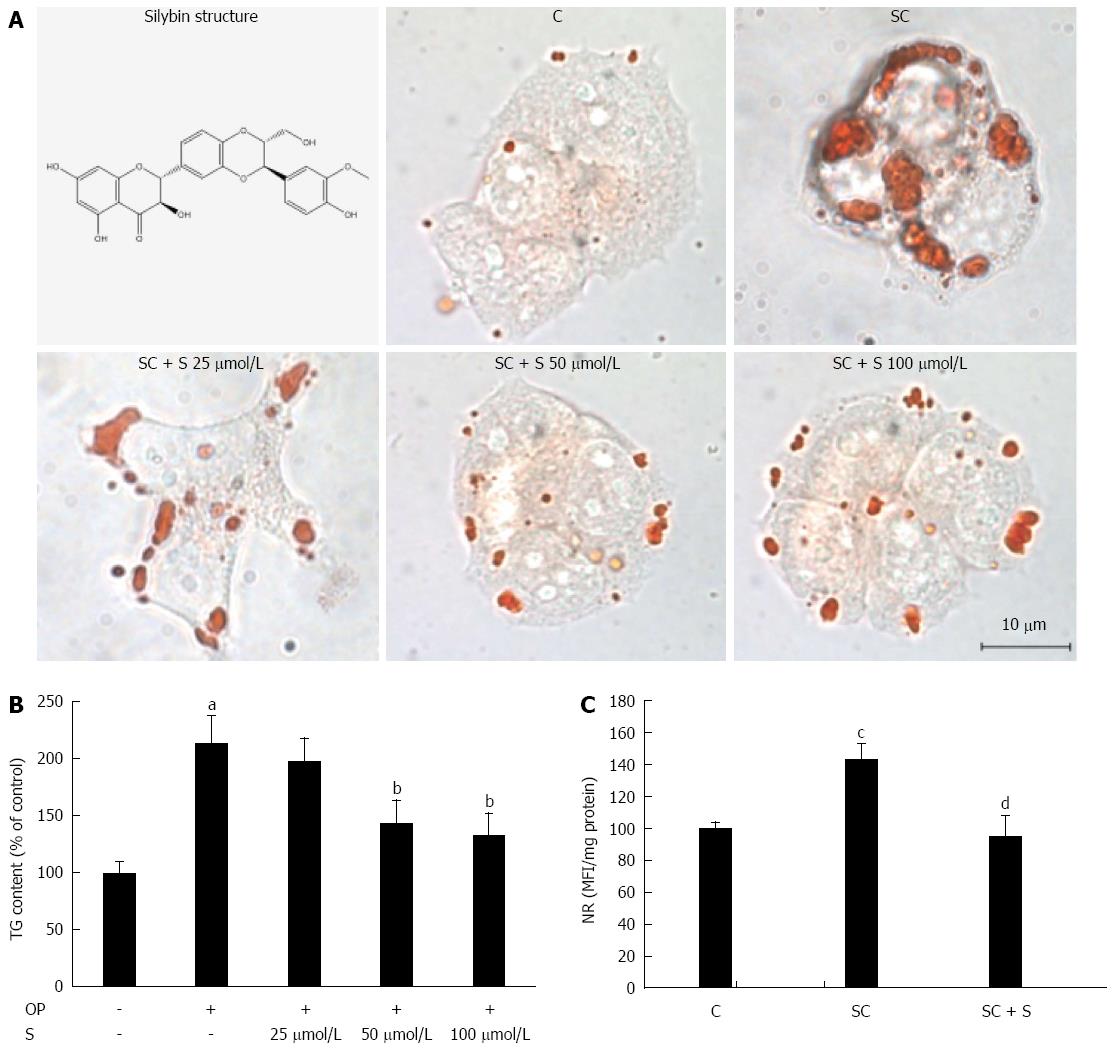
Figure 1 Lipid-lowering effects of silybin in steatotic FaO cells.
A: Neutral lipids were visualized in situ by ORO-staining in control (C) and steatotic FaO cells incubated in the absence (SC) or in the presence (SC + S) of the silybin at different doses (silybin 25; 50; 100 μmol/L) (magnification × 40; Bar: 10 μm). Silybin structure is also shown; B: On the same samples TG content was quantified by spectrophotometric assay; data are expressed as percent TG content relative to control and normalized for total proteins; C: LD accumulation was evaluated by NR-staining in control and steatotic FaO cells incubated in the absence or in the presence of 50 μmol/L silybin; data are expressed as percent mean fluorescence intensity (MFI) relative to control and normalized for total proteins. Values are mean ± SD from a least three independent experiments. ANOVA followed by Tukey’s test was used to assess the statistical significance between groups. Significant differences are denoted by symbols: aP≤0.001, cP≤0.01 C vs OP and bP≤ 0.001, dP≤ 0.01 OP vs silybin.
Figure 2 Effects of silybin on transcription factors regulating lipid metabolism.
In control (C) and steatotic FaO cells incubated in the absence (SC) or in the presence (SC + S) of silybin 50 μmol/L we assessed. A: mRNA expression of PPARα, PPARδ and PPARγ by qPCR; GAPDH was used as the internal control for quantifying gene expression; data expressed as fold induction with respect to controls; B: Densitometric analysis of SREBP-1c by Western blotting; β-actin was the protein loading control used as housekeeping gene for normalization; data are expressed as percentage values with respect to controls. Values are mean ± SD from at least three independent experiments. ANOVA followed by Tukey’s test was used to assess the statistical significance between groups Significant differences are denoted by symbols: cP≤ 0.01, eP≤ 0.05 C vs OP and dP≤ 0.01, fP≤ 0.05 OP vs Slybin.
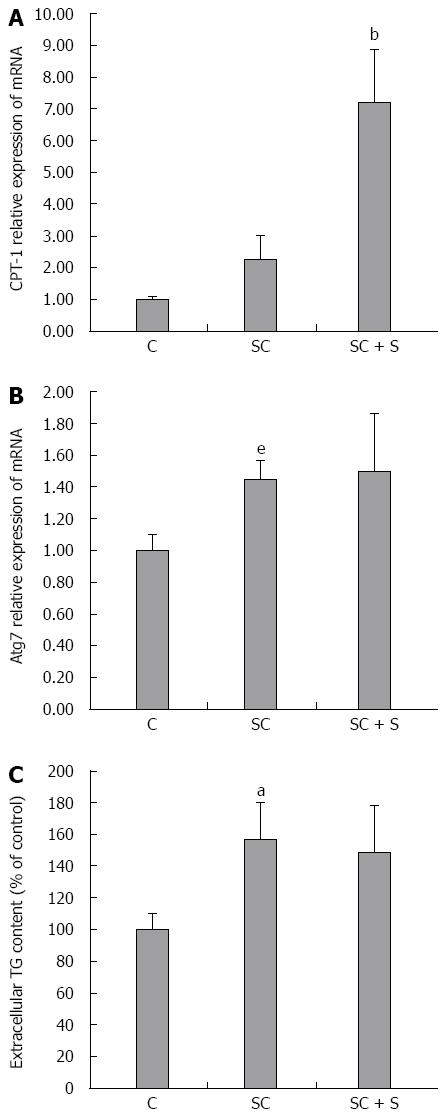
Figure 3 Effects of silybin on lipid catabolism pathways.
In control (C) and steatotic FaO cells incubated in the absence (SC) or in the presence (SC + S) of silybin 50 μmol/L we assessed: mRNA expression of CPT-1 (A) and of Atg7 (B) by qPCR; GAPDH was used as the internal control for quantifying gene expression and data expressed as fold induction with respect to controls; extracellular TG content quantified in the medium by spectrophotometric assay (C); data are expressed as percent TG content relative to control and normalized for total proteins; Values are mean ± SD from at least three independent experiments. ANOVA followed by Tukey’s test was used to assess the statistical significance between groups Significant differences are denoted by symbols: aP≤ 0.001, eP≤ 0.05 C vs OP and bP≤ 0.001, dP≤ 0.01 OP vs Slybin.
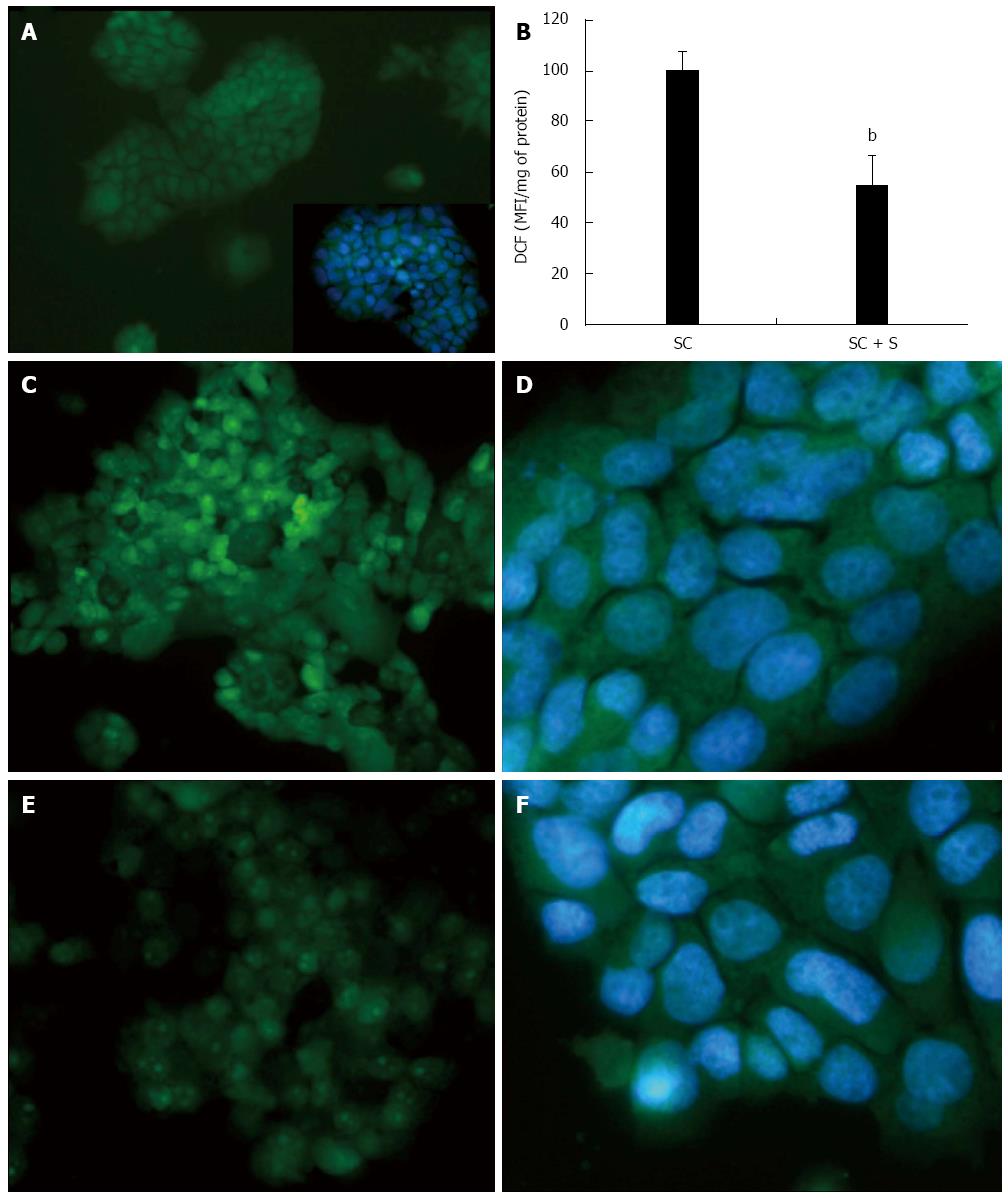
Figure 4 Effects of silybin on reactive oxygen species production.
The intracellular level of reactive oxygen species (ROS), mainly hydrogen peroxide, was visualized in situ by optical microscopy in control (A and inset) and steatotic FaO cells incubated in the absence (C and D) or in the presence (E and F) of silybin 50 μmol/L. The ROS level were also quantified by spectrofluorimeter assay of DCF-stained cells (B) and data are expressed as percent mean fluorescence intensity (MFI) relative to steatotic cells and normalized for total proteins. DCF: 2’-7’ dichlorofluorescein. bP < 0.001 SC vs SC + S
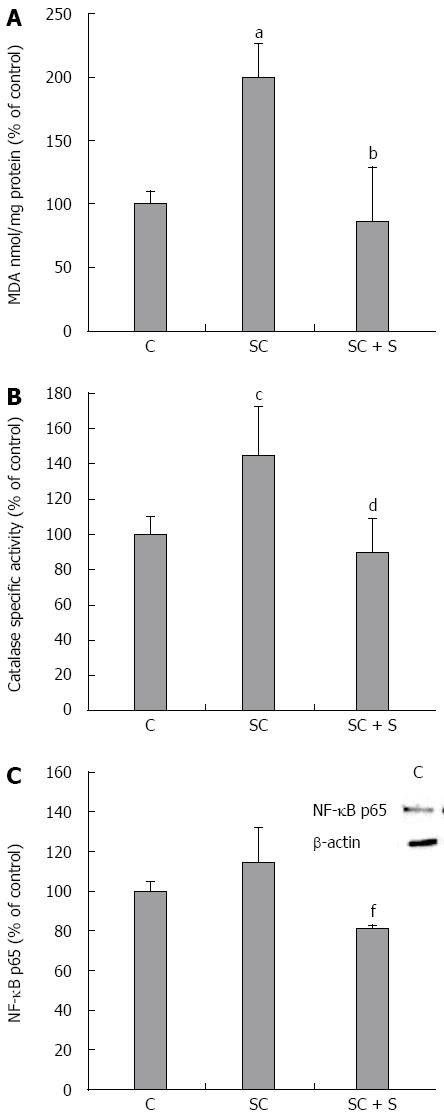
Figure 5 Effects of silybin on oxidative stress markers.
In control and steatotic FaO cells incubated in the absence or in the presence of silybin 50 μmol/L we assessed. A: The intracellular level of MDA (pmol MDA/mL x mg of sample protein) quantified by TBARS assay data are expressed as percentage values with respect to controls and normalized for total proteins; B: Catalase specific activity (micromoles of decomposed H2O2 per min/mg of sample protein) evaluated by spectrophotometric assay, data are expressed as percentage values with respect to controls and normalized for total proteins. C: Densitometric analysis of nuclear NF-κB/p65 evaluated by Western blotting; β-actin was the protein loading control used as housekeeping gene for normalization; data are expressed as percentage values with respect to controls. Values are mean ± SD from at least three independent experiments. ANOVA followed by Tukey’s test was used to assess the statistical significance between groups Significant differences are denoted by symbols: aP≤ 0.001, cP≤ 0.01 C vs OP and bP≤ 0.001; dP≤ 0.01; fP≤ 0.05 OP vs silybin.
- Citation: Vecchione G, Grasselli E, Voci A, Baldini F, Grattagliano I, Wang DQ, Portincasa P, Vergani L. Silybin counteracts lipid excess and oxidative stress in cultured steatotic hepatic cells. World J Gastroenterol 2016; 22(26): 6016-6026
- URL: https://www.wjgnet.com/1007-9327/full/v22/i26/6016.htm
- DOI: https://dx.doi.org/10.3748/wjg.v22.i26.6016


