Copyright
©The Author(s) 2016.
World J Gastroenterol. Jun 14, 2016; 22(22): 5183-5192
Published online Jun 14, 2016. doi: 10.3748/wjg.v22.i22.5183
Published online Jun 14, 2016. doi: 10.3748/wjg.v22.i22.5183
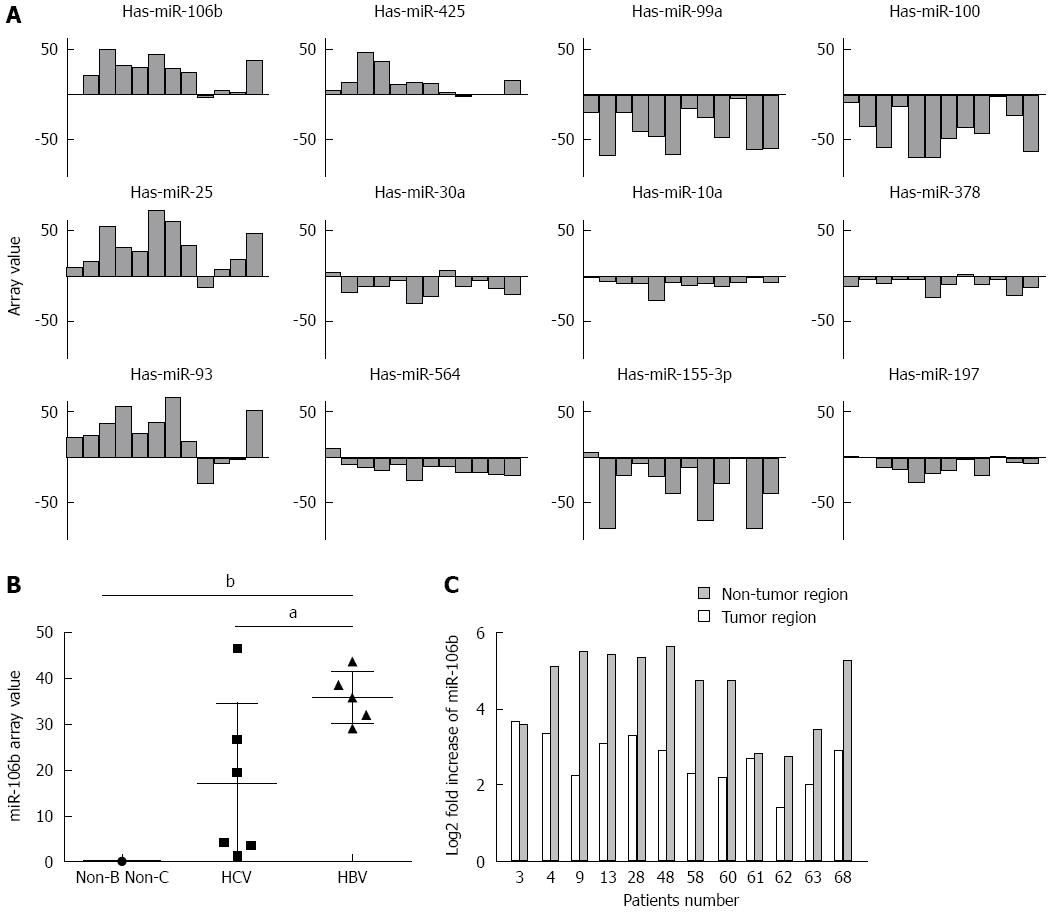
Figure 1 miRNA array analysis of the miRNA expression patterns in patients with distinct types of hepatocellular carcinoma (n = 12).
A: The top 12 miRNAs significantly dysregulated in the tumor regions of hepatocellular carcinoma (HCC) patients based on statistical results (P < 0.01); B: miR-106b expression levels in tumor regions of patients with hepatitis B virus (HBV) -associated HCC, HCV-associated HCC, and non-B/non-C HCC; C: q-RT-PCR analysis of miR-106b expression values in the tumor and adjacent non-tumor regions of patients. Fold-increases were calculated after comparing the results with the miR-106b expression levels in normal liver samples. Data represent the mean ± SD. aP < 0.05, bP < 0.001 vs HCV.
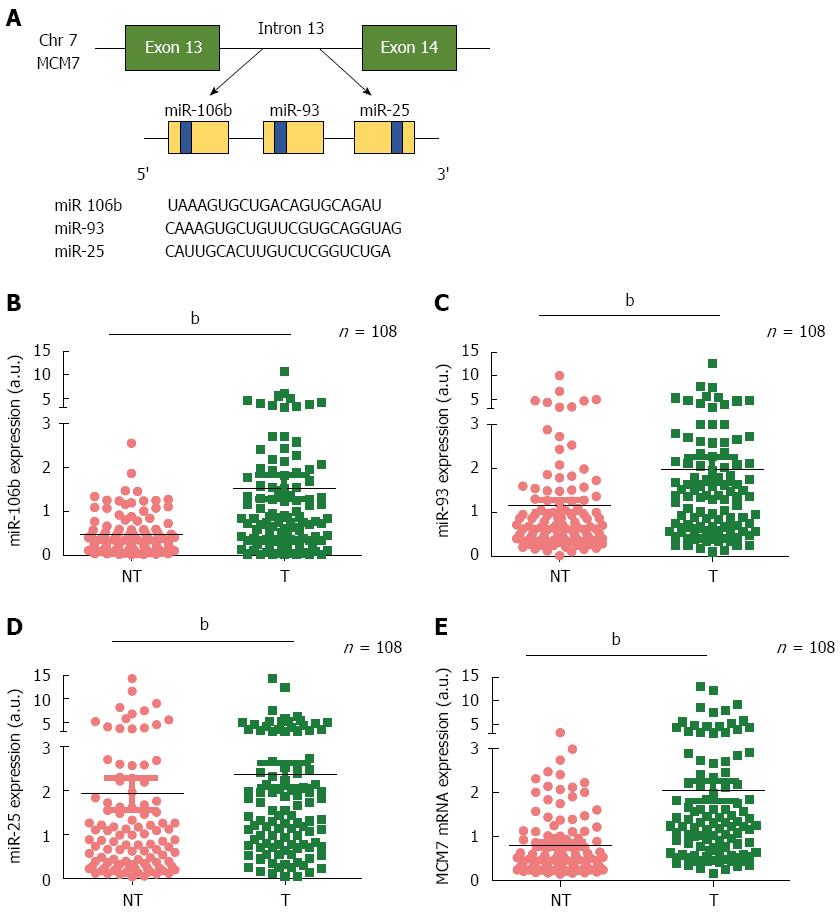
Figure 2 The mRNA expression levels of the miR-106b-25 cluster and MCM7 in tumor and non-tumor regions of hepatitis B virus-associated hepatocellular carcinoma patients (n = 108).
A: Schematic representation of the miR-106b-25 cluster of miRNA (miR-106b, miR-93 and miR-25) within the 13th intron of the MCM7 gene. The yellow boxes represent pre-miRNAs. The blue boxes represent mature miRNAs; B-E: miR-106b (B), miR-93 (C), miR-25 (D), and MCM7 (E) expression levels in the tumor and non-tumor regions of hepatitis B virus (HBV)-associated hepatocellular carcinoma (HCC) patients, determined using q-RT-PCR. bP < 0.001 NT vs T. a.u.: Arbitrary unit.
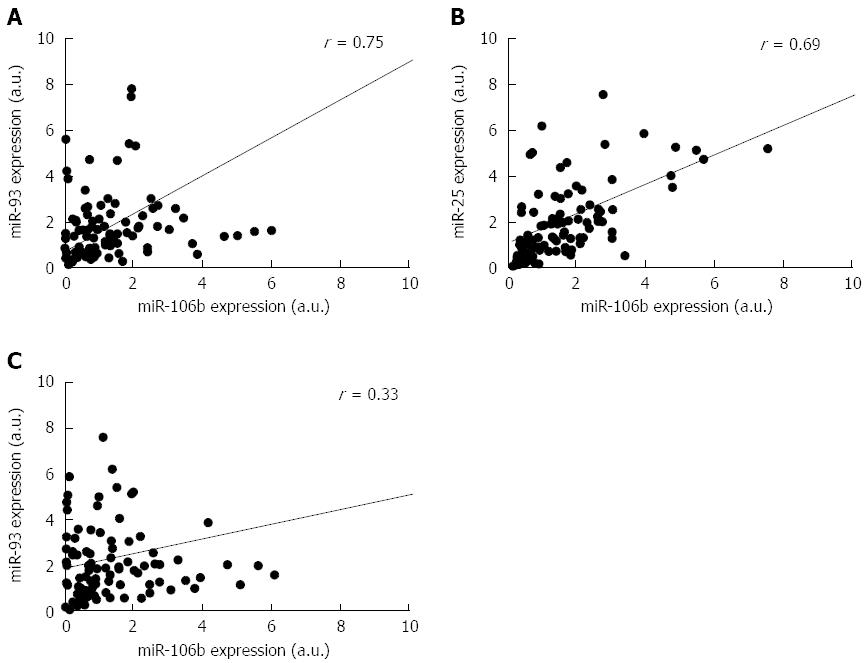
Figure 3 The correlation analysis miR-106b vs miR-93, miR-106b vs miR-25, and miR-93 vs miR-25 expression in tumor regions of patients with hepatitis B virus-associated hepatocellular carcinoma (n = 108).
A: The correlation between miR-106b and miR-93 expression; B: The correlation between miR-106b and miR-25 expression; C: The correlation between miR-93 and miR-25 expression. Data represent the correlation coefficient (r). a.u.: Arbitrary unit. HCC: Hepatocellular carcinoma; HBV: Hepatitis B virus.
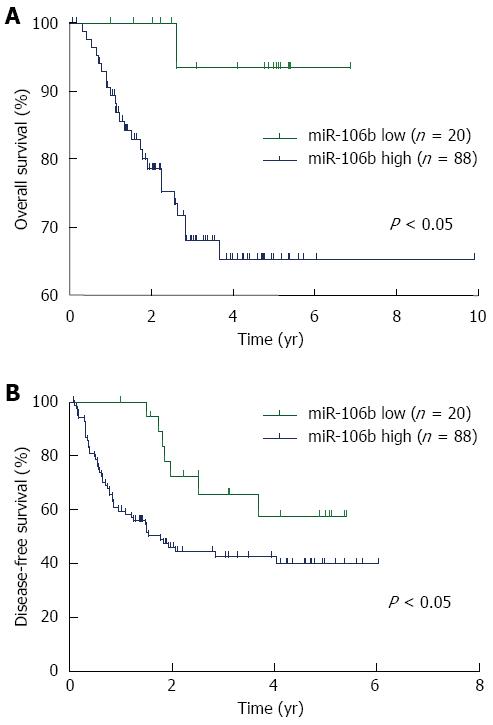
Figure 4 Kaplan-Meier overall and disease-free survival curve of patients with hepatitis B virus-associated hepatocellular carcinoma based on miR-106b expression (n = 108).
Hepatitis B virus (HBV)-associated hepatocellular carcinoma (HCC) patients were divided into two groups including miR-106b low (n = 20) and miR-106b high (n = 88) groups based on the expression levels of miR-106b. A: Overall survival curve; B: Disease-free survival curve. Log-rank test was used for statistical analysis. P < 0.05 was considered significant.
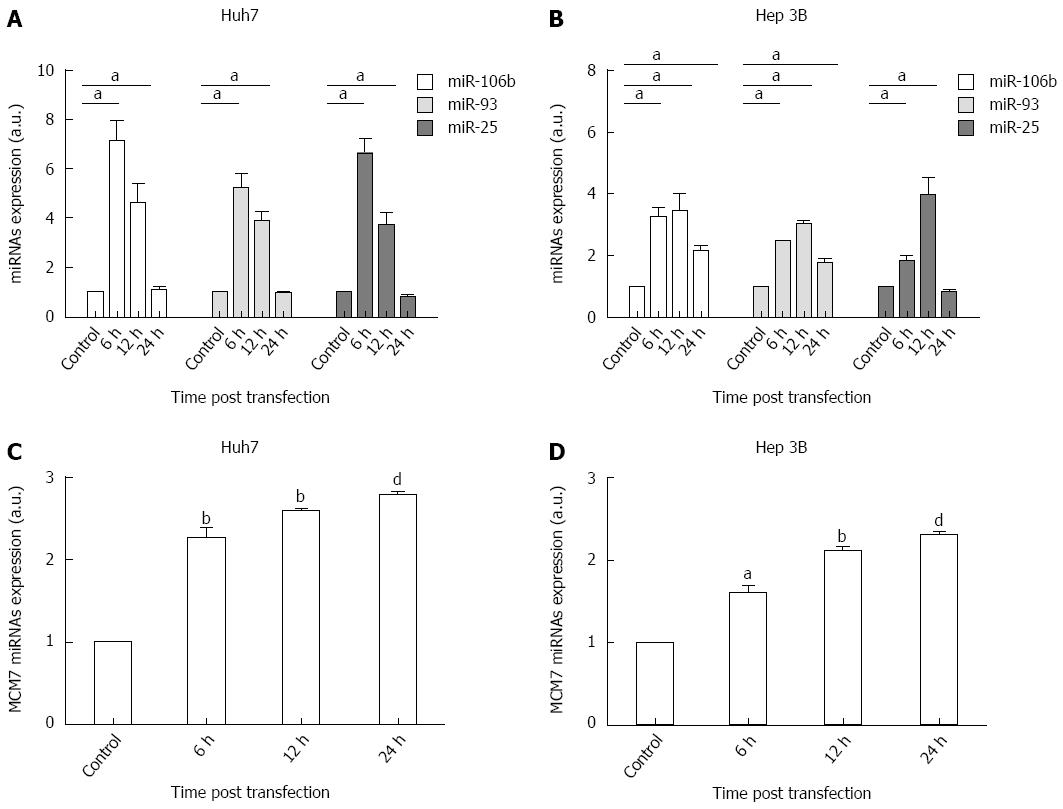
Figure 5 The mRNA expression levels of miR-106b-25 cluster and MCM7 in hepatitis B virus X protein-transfected hepatocellular carcinoma cell lines (n = 3).
The hepatitis B virus X protein (HBx) protein expression plasmid was transiently transfected into Huh7 and Hep-3B cells. miR-106b, miR-93, miR-25, and MCM7 expression levels at 0 (control), 6, 12, and 24 h post transfection were detected using q-RT-PCR. A: miRNAs expression levels in HBx-transfected Huh7 cells; B: miRNAs expression levels in HBx-transfected Hep-3B cells; C: MCM7 expression levels in HBx-transfected Huh7 cells; D: MCM7 expression levels in HBx-transfected Hep-3B cells. Data represent the mean ± SD. aP < 0.05, bP < 0.01, dP < 0.001 vs control. a.u.: Arbitrary unit. HCC: Hepatocellular carcinoma.
- Citation: Yen CS, Su ZR, Lee YP, Liu IT, Yen CJ. miR-106b promotes cancer progression in hepatitis B virus-associated hepatocellular carcinoma. World J Gastroenterol 2016; 22(22): 5183-5192
- URL: https://www.wjgnet.com/1007-9327/full/v22/i22/5183.htm
- DOI: https://dx.doi.org/10.3748/wjg.v22.i22.5183


