Copyright
©The Author(s) 2016.
World J Gastroenterol. Jun 14, 2016; 22(22): 5173-5182
Published online Jun 14, 2016. doi: 10.3748/wjg.v22.i22.5173
Published online Jun 14, 2016. doi: 10.3748/wjg.v22.i22.5173
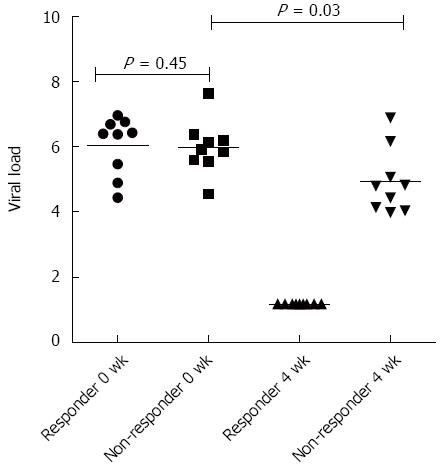
Figure 1 Difference between viral load in responders to antiviral therapy (at 0 and 4 wk) vs non-responders (0 and 4 wk).
No significant difference in the viral loads of responders vs non-responders at baseline, but when compared between baseline vs 4 wk (at RVR - rapid virological response) the viral load became undetectable in responders, while remained detectable in non-responders.
Figure 2 Heat map showing the expression of all the genes in different groups recruited.
Graphical representation showed up-regulated and down-regulated genes in all the recruited groups. NR: Non-responder; HC: Healthy controls; HT: Healthy treated; RESP: Responder.
Figure 3 Clustergram showing up-regulated and down-regulated gene expression in dendritic cells of A: moDCs from healthy volunteer differentiated in presence of HCV viral proteins (Test group) and moDCs differentiated in absence of viral antigens (control group); B: Responders and non-responders.
Graph showing the differentially expressed genes in different groups. Green represents the lower expression of a particular gene and red represents the higher expression of a particular gene in that particular group as compared to control.
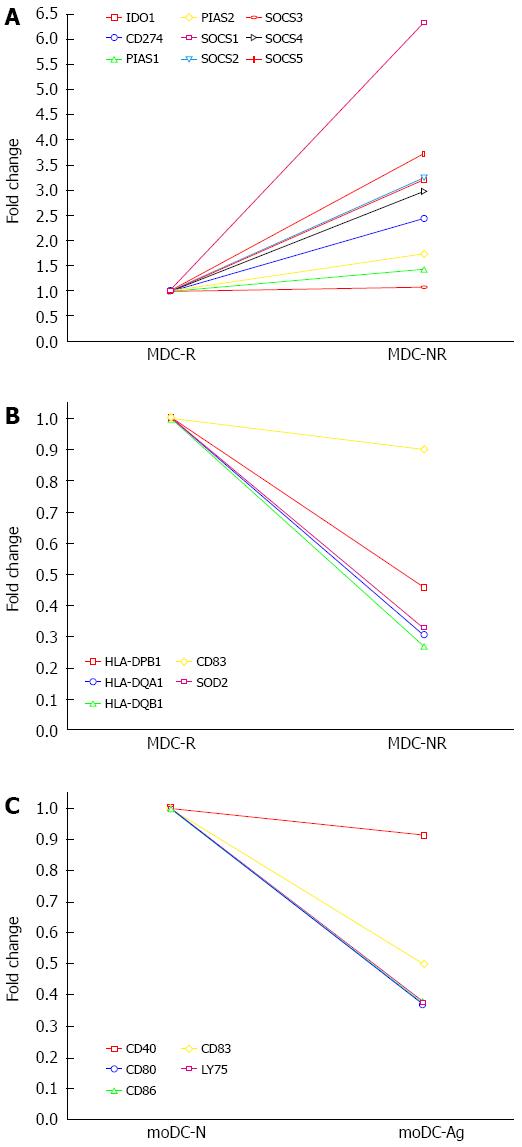
Figure 4 Multigroup plot showing A: up-regulation of down modulatory genes (negative regulators) in MDC-NR (non-responders) as compared to MDC-R (responders); B: Down-regulated genes in MDC-NR (Non-responders) as compared to the MDC-R (Responders); C: Down-regulation of genes involved with DC maturation and co-stimulatory molecules in the cells differentiated in the presence of viral antigens (moDC-Ag) as compared to cells without antigens (moDC-N).
The genes which are negative regulators of JAK-STAT such as suppressors of cytokine signaling (SOCS), protein inhibitors of activated STATs are up-regulated in non-responders as compared to responders whereas the genes which belong to MHC class II family such as HLA-DPB1, HLA-DQA1 and HLA-DQB1 and dendritic cell maturation marker such as CD83 is down-regulated in non-responders as compared to responders.
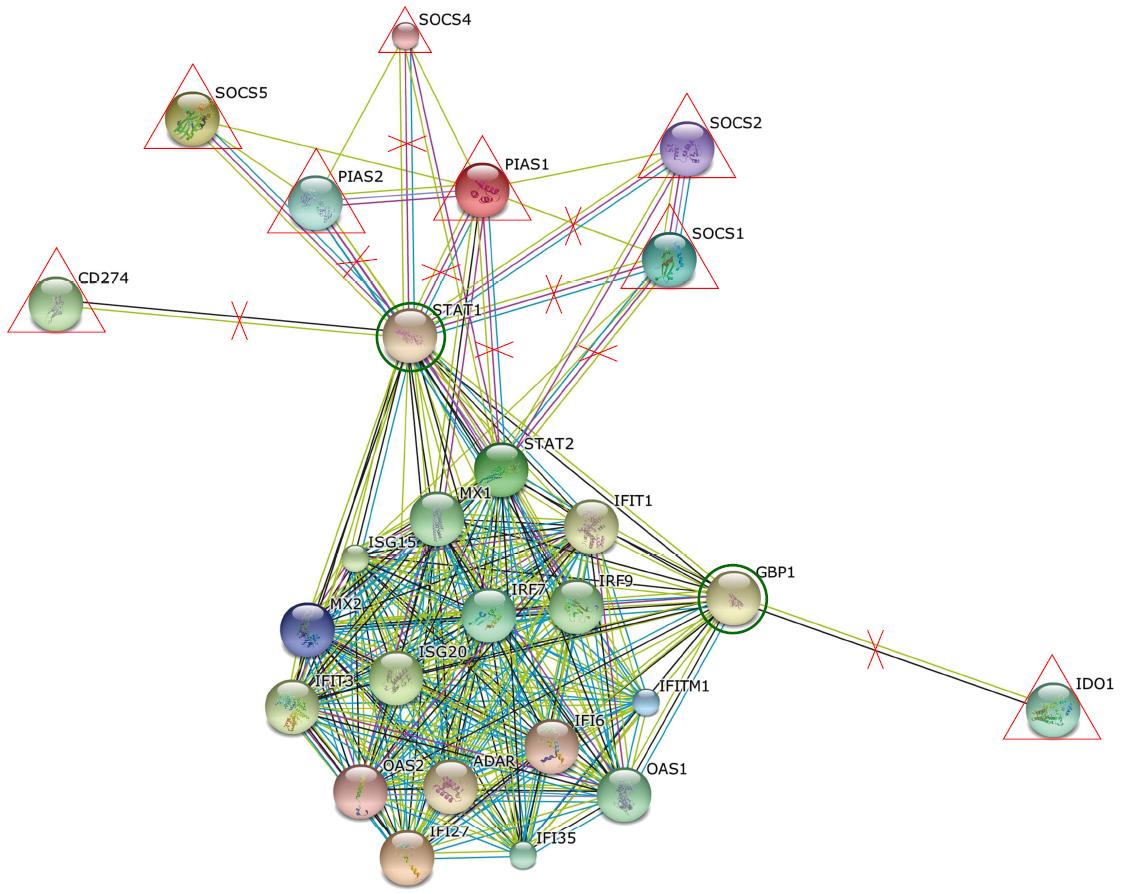
Figure 5 Interactions between different interferon stimulatory genes and negative regulatory genes of immune system.
Using string software, possible interaction pathways between different Interferon Stimulatory genes and Negative regulatory genes were drawn. Negative regulators such as SOCS, PIAS when upregulated results in the inhibition of STAT and GBP genes which in turn result in the induction of transcription of many genes involved in innate immunity and interferon signaling such as IRF7, IRF9 and ISG20. ISG: Interferon stimulatory genes.
- Citation: Tomer S, Chawla YK, Duseja A, Arora SK. Dominating expression of negative regulatory factors downmodulates major histocompatibility complex Class-II expression on dendritic cells in chronic hepatitis C infection. World J Gastroenterol 2016; 22(22): 5173-5182
- URL: https://www.wjgnet.com/1007-9327/full/v22/i22/5173.htm
- DOI: https://dx.doi.org/10.3748/wjg.v22.i22.5173


