Copyright
©The Author(s) 2016.
World J Gastroenterol. Jun 14, 2016; 22(22): 5154-5164
Published online Jun 14, 2016. doi: 10.3748/wjg.v22.i22.5154
Published online Jun 14, 2016. doi: 10.3748/wjg.v22.i22.5154
Figure 1 Representative micrographs from the distal colon of rats with chronic colitis 90 d after the first (A), second (B) or third (C) treatment with 2,4,6-trinitrobenzenesulfonic acid.
The frequency and size of the strictures (arrows) increased in the time and with the number of 2,4,6-trinitrobenzenesulfonic acid (TNBS) administrations.
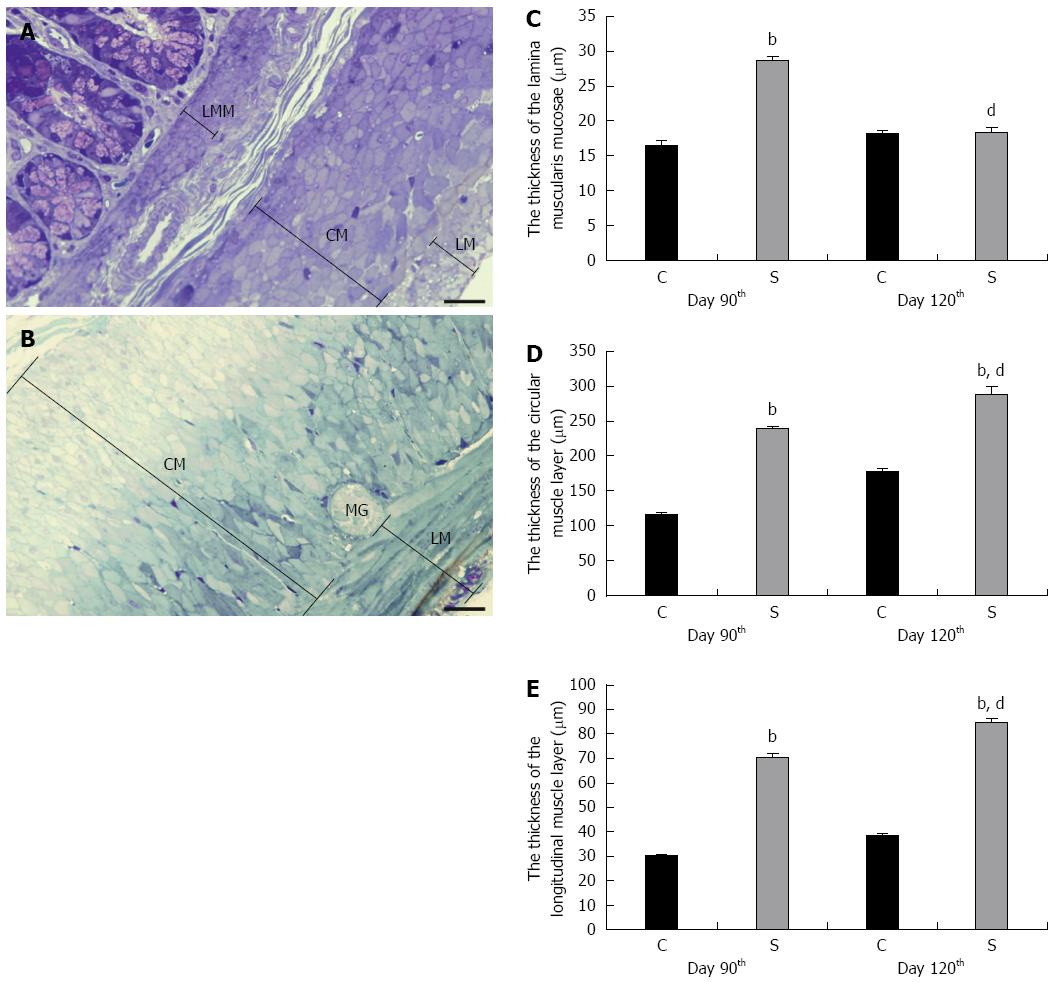
Figure 2 Thickness of the smooth muscle layers in the colon of control animals and in rats treated three times with 2,4,6-trinitrobenzenesulfonic acid.
A: Representative light micrographs of a toluidine blue-stained semithin section from the colon of a control rat; B: TNBS-treated rat on day 120 of the experimental period. Bar: 25 μm. Significant thickening of the LMM (C), CM (D) and LM (E) was demonstrated in the strictured gut wall of the TNBS-treated rats (S) relative to the controls (C) on day 90. Whereas a further significant thickening was measured in the CM and LM on day 120, the thickness of the LMM was similar to that in the controls at this timepoint. Data are expressed as mean ± SE. bP < 0.001 TNBS-treated groups vs age-matched controls; dP < 0.001 2,4,6-trinitrobenzenesulfonic acid (TNBS)-treated group on day 90 vs TNBS-treated group on day 120. LMM: Lamina muscularis mucosae; CM: Circular muscle layer; LM: Longitudinal muscle layer; MG: Myenteric ganglion.
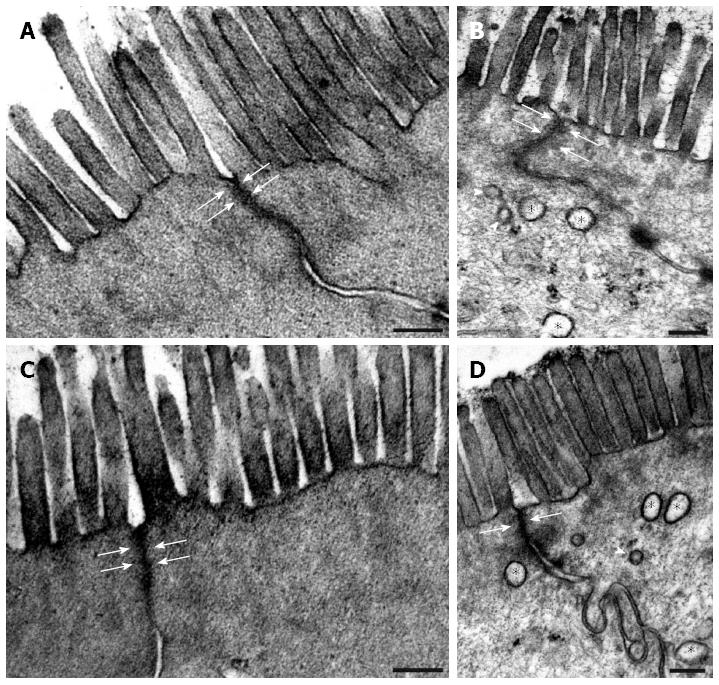
Figure 3 Representative electron micrographs of two neighbouring enterocytes from the colon of control animals (A, C) and in rats treated three times with 2,4,6-trinitrobenzenesulfonic acid.
On days 90 (B) and 120 (D) following the third 2,4,6-trinitrobenzenesulfonic acid (TNBS) administration, both the microvillar surface and the width of the apical intercellular tight junctions (arrows) of the enterocytes in the strictured regions were similar to those in the age-matched controls (A on day 90 and C on day 120). However, autophagosomes (asterisks) and lysosomes (arrowheads) were commonly observed within the epithelial cells of the strictured gut wall. Bars: 200 nm.
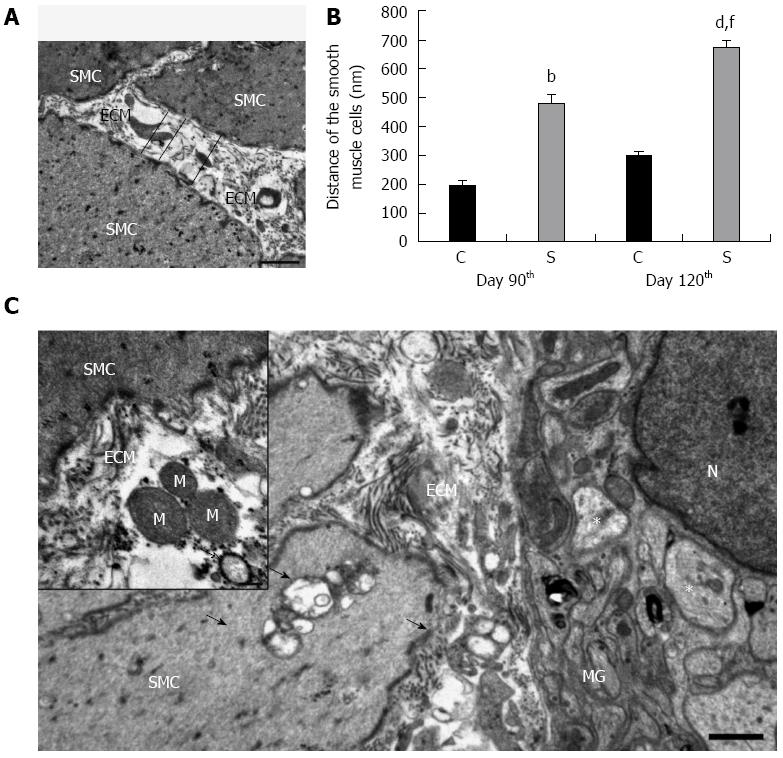
Figure 4 Ultrastructural alterations within the colon of control animals and in rats treated three times with 2,4,6-trinitrobenzenesulfonic acid.
Excess deposition of extracellular matrix (ECM) was observed within the smooth muscle layers in the ultrathin sections derived from the strictured region (A); Electronmicroscopic morphometry revealed that the distance between adjacent smooth muscle cells (SMCs) was significant larger in the strictured gut wall of the 2,4,6-trinitrobenzenesulfonic acid (TNBS)-treated rats (S) as compared with the gut wall of the control rats (C) on day 90 (B); A further significant increase in the mean separation distance of the SMCs was recorded on day 120 post-TNBS treatment (B). Data are expressed as mean ± SE. bP < 0.01, dP < 0.001 TNBS-treated groups vs age-matched controls; fP < 0.001 TNBS-treated group on the day 90 vs TNBS-treated group on day 120. Representative electron micrograph of the strictured colonic area 120 d after the third TNBS administration (C). Because of ECM accumulation, the SMCs also moved away from the myenteric ganglia (MGs). Swollen and empty confluent vacuoles of different sizes (arrows) were frequently seen in the SMCs and also in their close environment. Rupture of the plasma membrane and subsequent leakage of the cell organelles into the microenvironment, e.g., the mitochondria (M) and autophagosomes (hollow arrow), were frequently seen in the intercellular spaces (insert). However, the vast majority of the axons appeared normal; necrotic axons were rarely seen in the MGs (asterisks). N: Nucleus. Bars: 1 μm and 200 nm (insert).
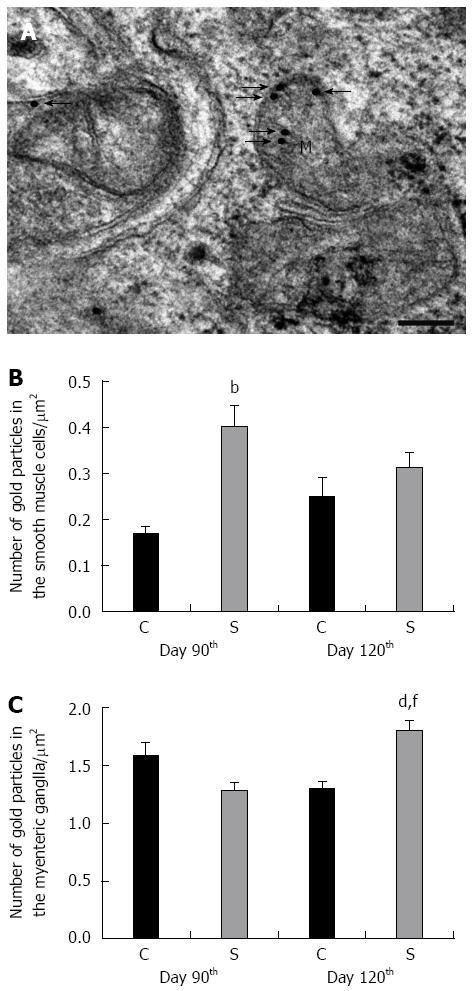
Figure 5 Post-embedding immunogold labelling for caspase 9 in the smooth muscle cells and myenteric ganglia in the colon of control animals and in rats treated three times with 2,4,6-trinitrobenzenesulfonic acid.
Representative electron micrograph of a myenteric ganglion (MG) from the strictured gut wall (S) 120 d after the third 2,4,6-trinitrobenzenesulfonic acid (TNBS) administration (A). The 18 nm gold particles labelling caspase 9 immunoreactivity (arrows) were mainly associated with mitochondria (M). Bar: 200 nm. The number of gold particles in the S was increased significantly in the smooth muscle cells on day 90 (B) and also in the MGs on day 120 (C) as compared with the gut wall in the control rats (C). Data are expressed as mean ± SE. bP < 0.01, dP < 0.001 TNBS-treated groups vs age-matched controls; fP < 0.01 TNBS-treated group on the day 90 vs TNBS-treated group on day 120.
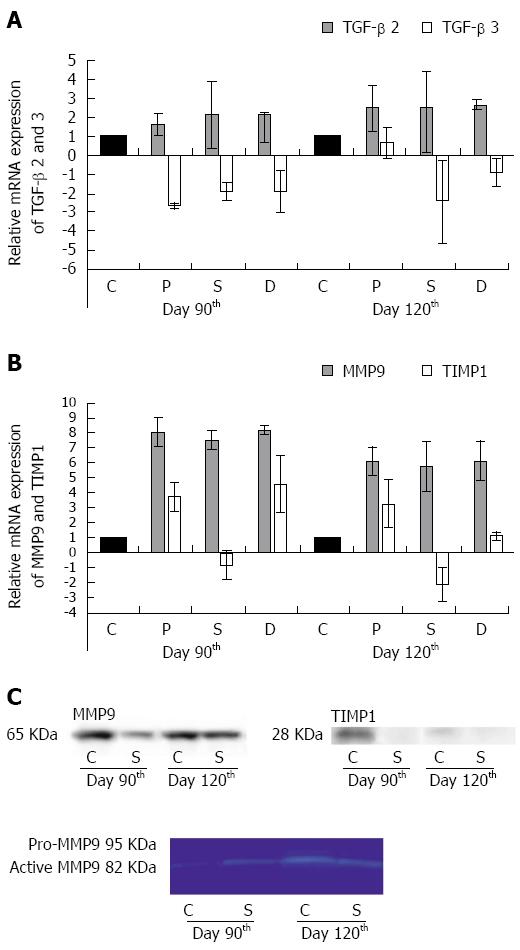
Figure 6 Relative mRNA and protein expression of transforming growth factor-beta 2 and 3, matrix metalloproteinase 9 and tissue inhibitor of metalloproteinases 1 in the colon of control animals and in rats treated three times with 2,4,6-trinitrobenzenesulfonic acid.
TGF-beta 2 was up-regulated in the strictured region (S) and also in the adjacent proximal (P) and distal (D) segments of the colon as compared with the controls (C) on day 90 and day 120 (A). TGF-beta 3 gene repression was detected both 90 and 120 d after the third TNBS treatment in each colonic segment (A). The marked overexpression of MMP9 mRNA was confirmed in each colonic segment in the chronic phase of the inflammation (B). TIMP1 mRNA expression was detected in the P and D colon segments at both timepoints examined, but in the S the gene was down-regulated (B). Data are expressed as mean ± SD. 90 d after the third TNBS treatment, a decreased MMP9 protein level was detected in the S relative to the C (C, upper). Nevertheless, on day 120 the MMP9 protein expression was similar to that in the C. The activity of MMP9 was determined by gelatine zymography (C, lower). An active form of the MMP9 protein rather than pro-MMP9 was expressed in the C and S segments at both timepoints examined. Well-detectable amounts of TIMP1 protein were revealed only in the control samples from day 90 (C, right side).
- Citation: Talapka P, Berkó A, Nagy LI, Chandrakumar L, Bagyánszki M, Puskás LG, Fekete &, Bódi N. Structural and molecular features of intestinal strictures in rats with Crohn's-like disease. World J Gastroenterol 2016; 22(22): 5154-5164
- URL: https://www.wjgnet.com/1007-9327/full/v22/i22/5154.htm
- DOI: https://dx.doi.org/10.3748/wjg.v22.i22.5154


