Copyright
©The Author(s) 2016.
World J Gastroenterol. May 28, 2016; 22(20): 4926-4935
Published online May 28, 2016. doi: 10.3748/wjg.v22.i20.4926
Published online May 28, 2016. doi: 10.3748/wjg.v22.i20.4926
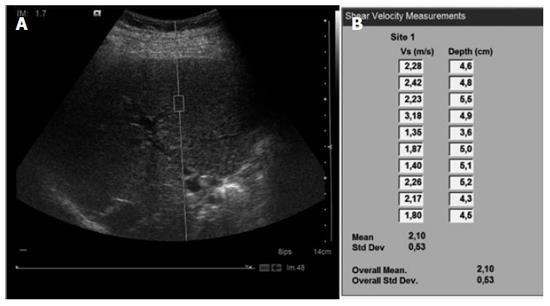
Figure 1 Image of liver stiffness measurement by acoustic radiation force impulse in patients with alcoholic liver disease.
A: Acoustic radiation force impulse examination of a patient; B: Ten values with associated depths.
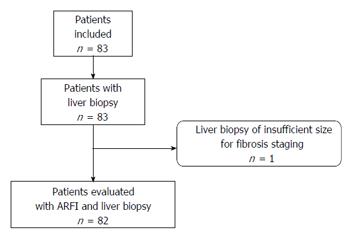
Figure 2 Patient flowchart.
ARFI: Acoustic radiation force impulse.
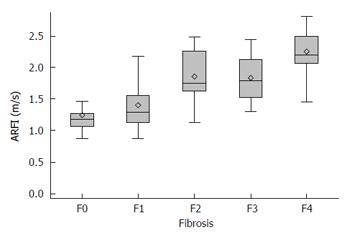
Figure 3 Relationship between acoustic radiation force impulse predicting values and histological fibrosis stages.
The relationship was significant between the velocity of the sheer wave (median of 10 ARFI values) and the fibrosis stage (assessed by the METAVIR score on biopsies) in all 82 patients (P < 0.0001). The box represents the interquartile range, the horizontal line in the box indicates the median value and the diamond indicates the mean value. The horizontal lines above and below the box indicate the maximum and minimum values.
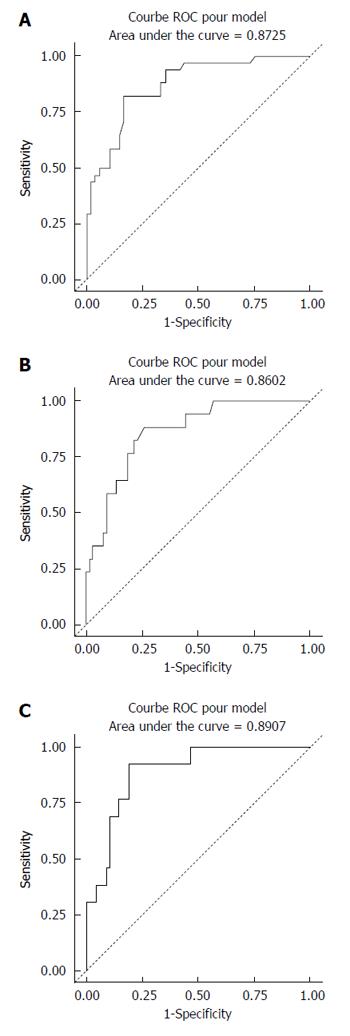
Figure 4 Receiver operating characteristic curves of acoustic radiation force impulse predicting liver fibrosis in patients with alcoholic liver disease.
A: ROC curve for F ≥ 2; B: ROC curve for F ≥ 3; C: ROC curve for F = 4.
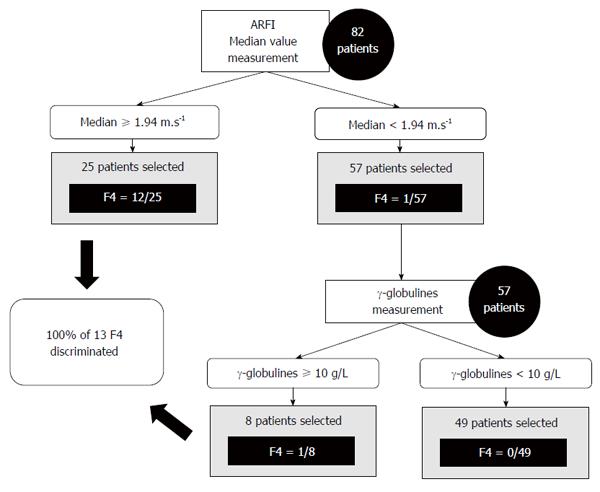
Figure 5 Decision tree for acoustic radiation force impulse predicting as a screening test for F = 4.
- Citation: Kiani A, Brun V, Lainé F, Turlin B, Morcet J, Michalak S, Le Gruyer A, Legros L, Bardou-Jacquet E, Gandon Y, Moirand R. Acoustic radiation force impulse imaging for assessing liver fibrosis in alcoholic liver disease. World J Gastroenterol 2016; 22(20): 4926-4935
- URL: https://www.wjgnet.com/1007-9327/full/v22/i20/4926.htm
- DOI: https://dx.doi.org/10.3748/wjg.v22.i20.4926


