Copyright
©The Author(s) 2016.
World J Gastroenterol. May 28, 2016; 22(20): 4891-4900
Published online May 28, 2016. doi: 10.3748/wjg.v22.i20.4891
Published online May 28, 2016. doi: 10.3748/wjg.v22.i20.4891
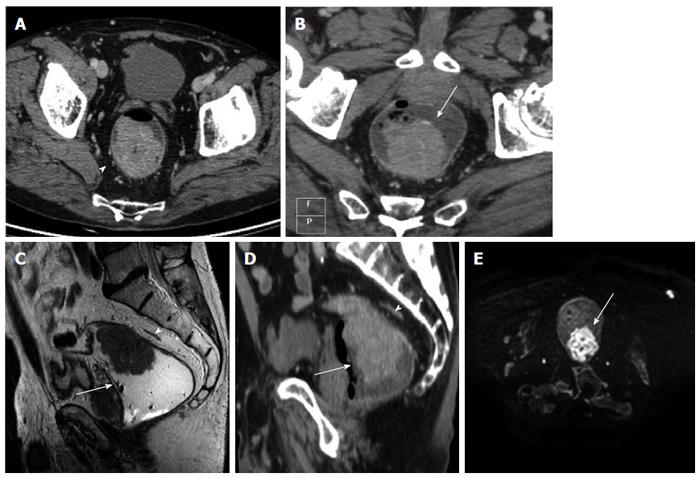
Figure 1 Images obtained in a 54 years-old man with middle-high rectal cancer.
A: The pure axial contrast enhanced computed tomography (CE-CT) image shows a tumor, as a intraluminal polypoid mass, with spiculated configuration margin and spread through the mesorectal fat. The tumour does not involve the mesorectal fascia (MRF) (arrowhead); B: Multiplanar reconstruction (MPR) MDCT images, along the axial plane of tumour axis, shows the presence of the tumor (arrow) with no involvement of the MRF; C: T2 (TSE) MRI image of the same patient (sagittal plane), shows the tumor as a polypoid mass (arrow), along the posterior burden of the rectum infiltrating through the muscularis propria into the mesorectal fat without MRF involvement (arrowhead); D: CE-CT MPR image (sagittal slice), at the same level shows the tumour as a polypoid mass inside the rectal lumen infiltrating the mesorectal fat without MRF involvement (arrowhead); E: DWIBS image (b-value 1000), the tumor presents high signal, due to restricted water diffusion; the normal rectal wall or the surrounding tissues have a lower signal intensity in comparison with the polypoid mass. The mesorectal (arrow) fascia is not detectable.
Figure 2 Images obtained in a 64 years-old man with middle rectal cancer.
A: Axial contrast enhanced computed tomography (CE-CT) image shows the tumour as an irregular mural thickening of the anterior rectal wall with possible infiltration into the perirectal fat. The mesorectal fascia is seen as a thin line (arrowhead) surrounding the mesorectal fat and is not involved by the tumor (arrow); B: Multiplanar reconstruction (MPR) para-axial CE CT image of the same patient shows the tumour as an irregular mural thickening of the anterior rectal wall (arrow) with no infiltration into the perirectal fat. The mesorectal fascia (arrowhead) is better defined in MPR para-axial CT image; C: T2 (TSE) MRI image of the same patient shows the tumour as a lesion of the anterior rectal wall, slightly hyperintense compared to the muscle, that extends through the hypo-intense muscle layer into the perirectal fat (arrow) and without mesorectal fascia involvement (arrowhead); D: Orthogonal axial high-resolution T2-weighted MR image of the same patient shows an intraluminal mass (arrows) confined to the intact, hypo-intense muscularis propria (the proper muscle layer is shown as a low intensity band (*). The mesorectal fascia (arrowhead).
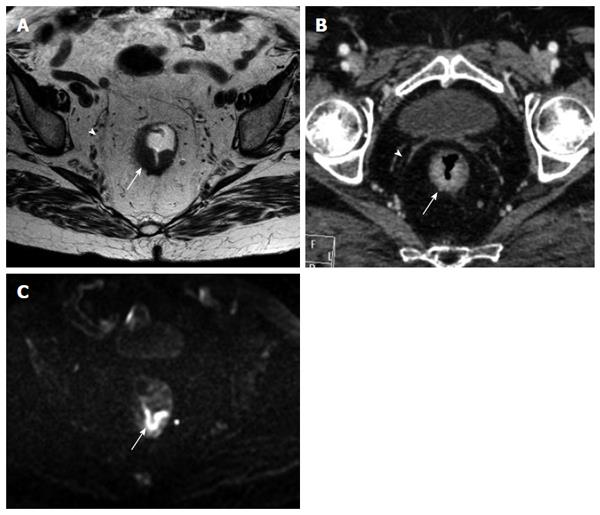
Figure 3 Images obtained in an 86 year-old woman with middle rectal cancer.
A: Orthogonal axial high-resolution T2-weighted MR image shows the tumor as a thickening (arrow) along the posterior aspect of the rectum, infiltrating through the muscularis propria (the band of proper muscle layer (*) is destroyed) into the mesorectal fat. The mesorectal fascia is seen as a thin hypointense line (arrowhead) surrounding the mesorectal fat; B: Multiplanar reconstruction (MPR) para-axial contrast enhanced computed tomography image of the same patient shows the tumour as an irregular mural thickening of the posterior rectal wall with spiculations extending into the peri-rectal fat. The mesorectal fascia is well defined and not involved (arrowhead); C: DWIBS image (b-value 1000), the tumor (arrow) is clearly recognizable as high signal in comparison with the lower signal intensity of the normal rectal wall.
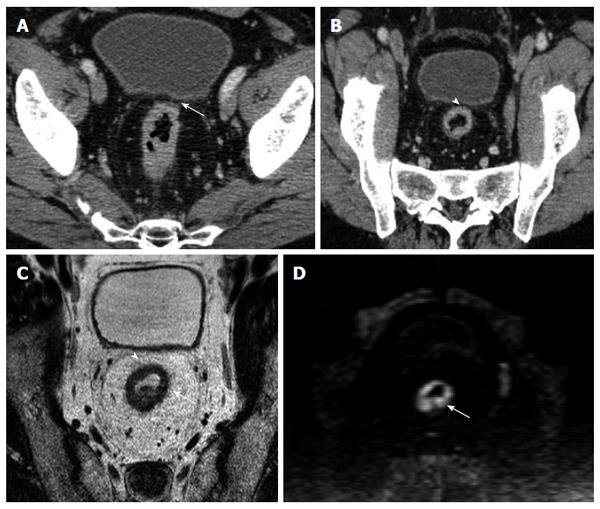
Figure 4 Images obtained in a 68 years-old man with high rectal cancer.
A: Axial computed tomography (CT) image shows a tumor as a circumferential thickening in the bowel wall; in the anterior wall (arrow) the tumor seems to involve the mesorectal fascia (MRF); B: Multiplanar reconstruction CT images shows a visible fat line between the tumor and the MRF (arrowhead); C: Axial T2-weighted magnetic resonance image shows a rectal wall involvement by the tumor but also a wide fat pad between the tumor and the free MRF; D: DWIBS image (b-value 1000), the tumor is depicted as a high signal circumferential thickening of the bowel wall, in comparison with the lower signal intensity of surrounding tissue.
- Citation: Ippolito D, Drago SG, Franzesi CT, Fior D, Sironi S. Rectal cancer staging: Multidetector-row computed tomography diagnostic accuracy in assessment of mesorectal fascia invasion. World J Gastroenterol 2016; 22(20): 4891-4900
- URL: https://www.wjgnet.com/1007-9327/full/v22/i20/4891.htm
- DOI: https://dx.doi.org/10.3748/wjg.v22.i20.4891


