Copyright
©The Author(s) 2016.
World J Gastroenterol. May 28, 2016; 22(20): 4848-4859
Published online May 28, 2016. doi: 10.3748/wjg.v22.i20.4848
Published online May 28, 2016. doi: 10.3748/wjg.v22.i20.4848
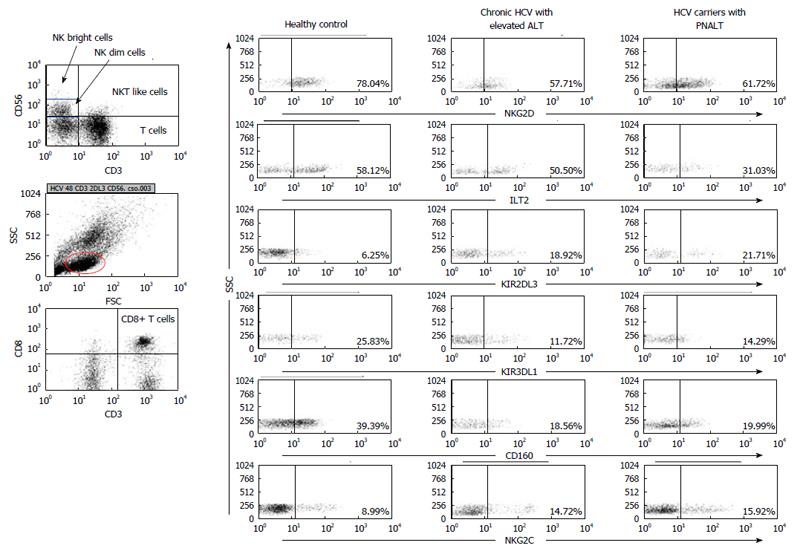
Figure 1 Gating strategy and representative flow cytometric dot plots.
Figure 1 shows the gating technique used to detect different lymphocyte subpopulations. For analysis of NK, NKdim, NKbright, NKT-like and CD8+ T cells cells lymphogate was created based on physical characteristics typical of lymphoid cells using forward and side scatter parameters. Representative dot plots show the expression of NKG2D, ILT-2, KIR2DL3, KIR3DL1, CD160 and NKG2C by NK cells in the peripheral blood from patients with chronic HCV with elevated ALT or PNALT and in healthy individuals. HCV: Hepatitis C virus; ALT: Alanine aminotransferase; PNALT: Persistently normal ALT; NK: Natural killer cell.
Figure 2 Activating natural killer cell receptor expression by natural killer cells in the peripheral blood from patients with chronic hepatitis C virus with elevated alanine aminotransferase or persistently normal alanine aminotransferase and in healthy individuals.
The expression of CD160 (A-C), NKG2D (D-F) and NKG2C (G-I) by NK cells and NK cell subsets in the peripheral blood from patients with chronic HCV with elevated ALT or PNALT and in healthy individuals. The solid bars represent medians; the boxes indicate the interquartile ranges and the lines show the most extreme observations. Differences were considered statistically significant for P values ≤ 0.05. HCV: Hepatitis C virus; ALT: Alanine aminotransferase; PNALT: Persistently normal ALT; NK: Natural killer cell.
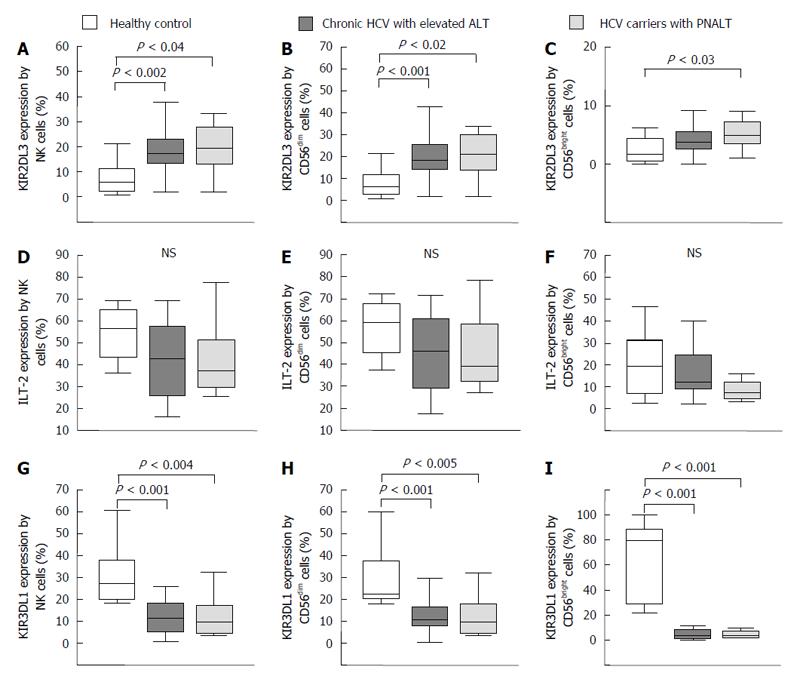
Figure 3 Inhibitory natural killer cell receptor expression by natural killer cells in the peripheral blood from patients with chronic hepatitis C virus with elevated alanine aminotransferase or persistently normal alanine aminotransferase and in healthy individuals.
The expression of KIR2DL3 (A-C), ILT-2 (D-F) and KIR3DL1 (G-I) by NK cells and NK cell subsets in the peripheral blood from patients with chronic HCV with elevated ALT or PNALT and in healthy individuals. The solid bars represent medians; the boxes indicate the interquartile ranges and the lines show the most extreme observations. Differences were considered statistically significant for P values ≤ 0.05. HCV: Hepatitis C virus; ALT: Alanine aminotransferase; PNALT: Persistently normal ALT; NK: Natural killer cell.
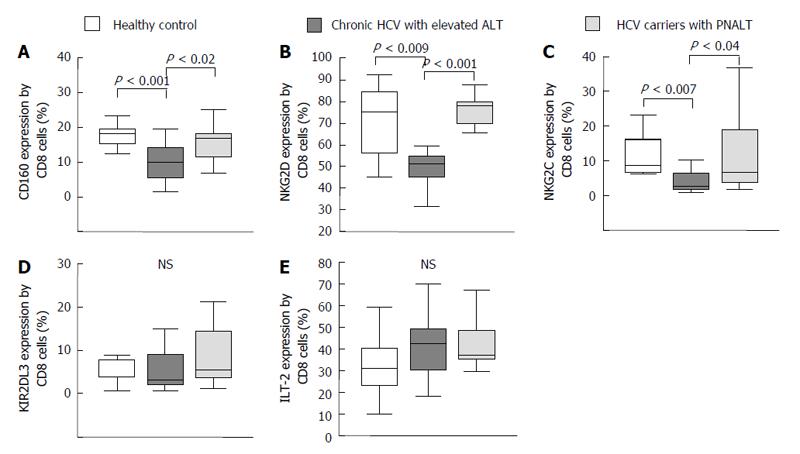
Figure 4 Activating and inhibitory natural killer cell receptor expression by CD8+ T cells in the peripheral blood from patients with chronic hepatitis C virus with elevated alanine aminotransferase or persistently normal alanine aminotransferase and in healthy individuals.
The expression of CD160 (A), NKG2D (B), NKG2C (C), KIR2DL3 (D) and ILT-2 (E) by CD8+ T cells in the peripheral blood from patients with chronic HCV with elevated ALT or PNALT and in healthy individuals. The solid bars represent medians; the boxes indicate the interquartile ranges and the lines show the most extreme observations. Differences were considered statistically significant for P values ≤ 0.05. HCV: Hepatitis C virus; ALT: Alanine aminotransferase; PNALT: Persistently normal ALT; NK: Natural killer cell.
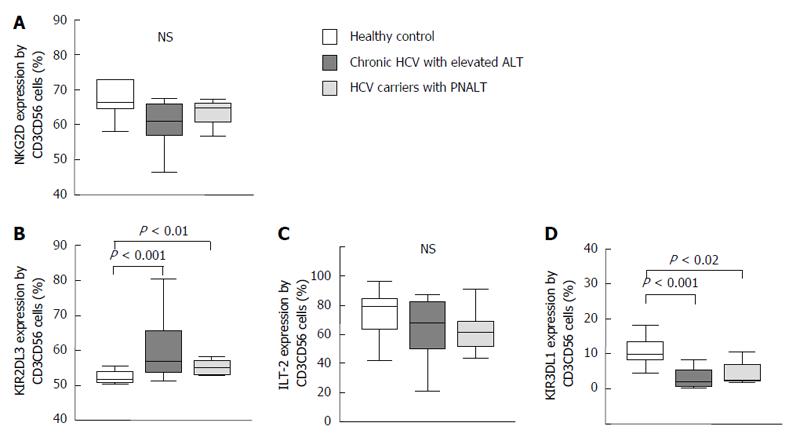
Figure 5 Activating and inhibitory natural killer cell receptor expression by NKT-like cells in the peripheral blood from patients with chronic hepatitis C virus with elevated alanine aminotransferase or persistently normal alanine aminotransferase and in healthy individuals.
The expression of NKG2D (A), KIR2DL3 (B), ILT-2 (C) and KIR3DL1 (D) by NKT-like cells in the peripheral blood from patients with chronic HCV with elevated ALT or PNALT and in healthy individuals. The solid bars represent medians; the boxes indicate the interquartile ranges and the lines show the most extreme observations. Differences were considered statistically significant for P values ≤ 0.05. HCV: Hepatitis C virus; ALT: Alanine aminotransferase; PNALT: Persistently normal ALT; NK: Natural killer cell.
Figure 6 Natural killer cell cytotoxicity against K562 cells in patients with chronic hepatitis C virus with elevated alanine aminotransferase or persistently normal alanine aminotransferase and in healthy individuals and the effect of in vitro TGF-β1 treatment on the cytotoxicity and natural killer cell receptor expression of freshly isolated natural killer cells.
A: Cytotoxicity of NK cells isolated from healthy individuals, HCV carriers with PNALT and chronic HCV with elevated ALT. Cytotoxic activity of NK cells as a percentage of lysed cells is indicated in patients with chronic HCV with elevated ALT or PNALT and in healthy individuals at different effector and target cell ratios. Statistical comparisons were made by using one-way ANOVA with Bonferroni correction. The results were expressed as the mean value ± standard error of the mean (SEM). aP≤ 0.05, significant from patients with chronic HCV with elevated ALT and healthy individuals. B: Cytotoxicity of TGF-β treated NK cells isolated from healthy individuals. Cytotoxic activity of NK cells as a percentage of lysed cells is indicated after TGFβ1 treatment (1 ng/mL) at different effector and target cell ratios. C: Expression of NKG2D, KIR2DL3 and CD160 receptors by TGF-β-treated NK cells. Different NK cell receptor expression by NK cells after TGFβ1 treatment (1 ng/mL). Statistical comparisons were made by one-way ANOVA with Bonferroni correction. The solid bars represent medians; the boxes indicate the interquartile ranges and the lines show the most extreme observations. Differences were considered statistically significant for P values ≤ 0.05. E: Effector cell; T: Target cell; HCV: Hepatitis C virus; ALT: Alanine aminotransferase; PNALT: Persistently normal ALT; NK: Natural killer cell.
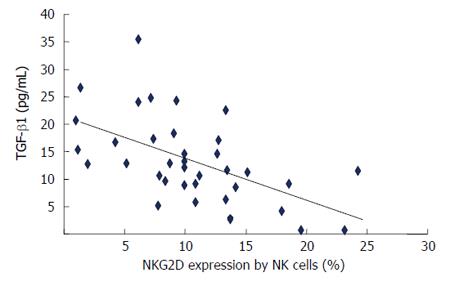
Figure 7 The correlation of plasma transforming growth factor β1 levels with NKG2D expression by natural killer cells in patients with chronic hepatitis C virus hepatitis.
Shown is plasma TGF-β1 levels with NKG2D expressed by NK cells. Correlation between variables was assessed by calculating Spearman rank correlation coefficient. NK: Natural killer cell; TGF-β1: Transforming growth factor β1.
- Citation: Szereday L, Meggyes M, Halasz M, Szekeres-Bartho J, Par A, Par G. Immunological changes in different patient populations with chronic hepatitis C virus infection. World J Gastroenterol 2016; 22(20): 4848-4859
- URL: https://www.wjgnet.com/1007-9327/full/v22/i20/4848.htm
- DOI: https://dx.doi.org/10.3748/wjg.v22.i20.4848


