Copyright
©The Author(s) 2016.
World J Gastroenterol. Jan 14, 2016; 22(2): 790-800
Published online Jan 14, 2016. doi: 10.3748/wjg.v22.i2.790
Published online Jan 14, 2016. doi: 10.3748/wjg.v22.i2.790
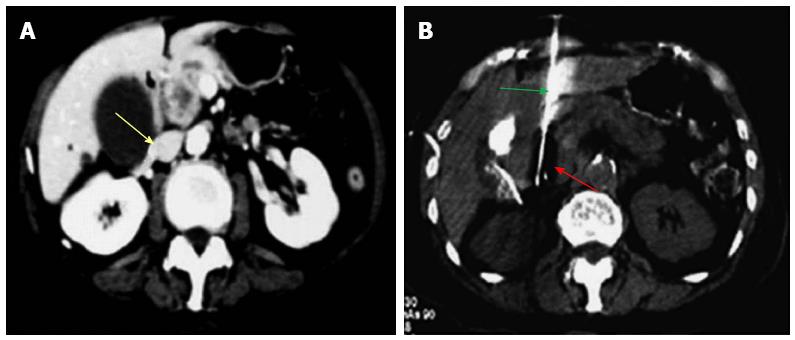
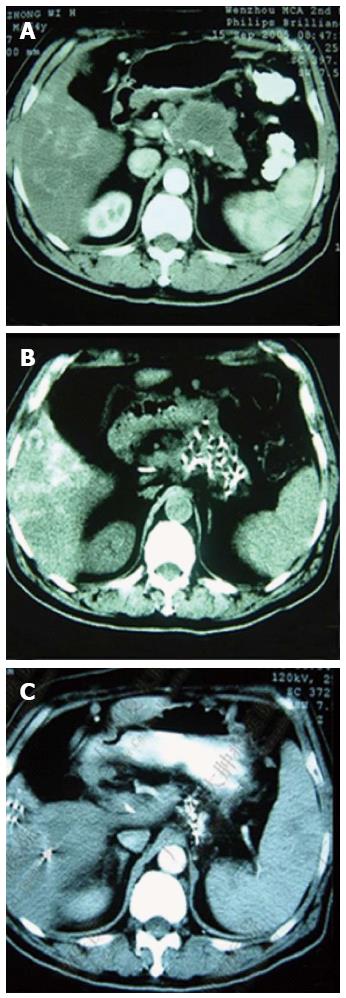
Figure 1 Percutaneous cryoablation of pancreatic cancer under computed tomography guidance.
The images were taken via the stomach. A: The cryoprobe (green arrow) was percutaneously inserted into the tumor at the head of the pancreas via the stomach (yellow arrow); B: The ice ball beginning to form (red arrow) following the application of argon gas; C: The ice ball (red arrow) surrounding the probe shows a gradual increase in size.
Figure 2 Percutaneous cryoablation of pancreatic cancer under enhanced computed tomography guidance.
The images were taken via the left lobe of the liver. A: The tumor at the head of the pancreas (yellow arrow) is visible with high intensity; B: The probe (green arrow) was percutaneously inserted into the tumor via the left lobe of the liver; the ice ball appears as a dark area (red arrow).
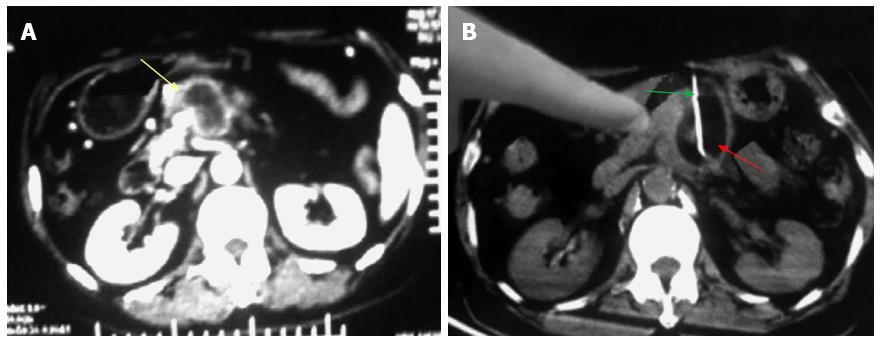
Figure 3 Percutaneous cryoablation of pancreatic cancer under enhanced computed tomography guidance.
The images were taken between the stomach and transverse colon. A: The tumor at the head of the pancreas (yellow arrow) is visible with high intensity; B: The probe (green arrow) was percutaneously inserted into the tumor between the stomach and transverse colon; the ice ball is shown as a dark area (red arrow).
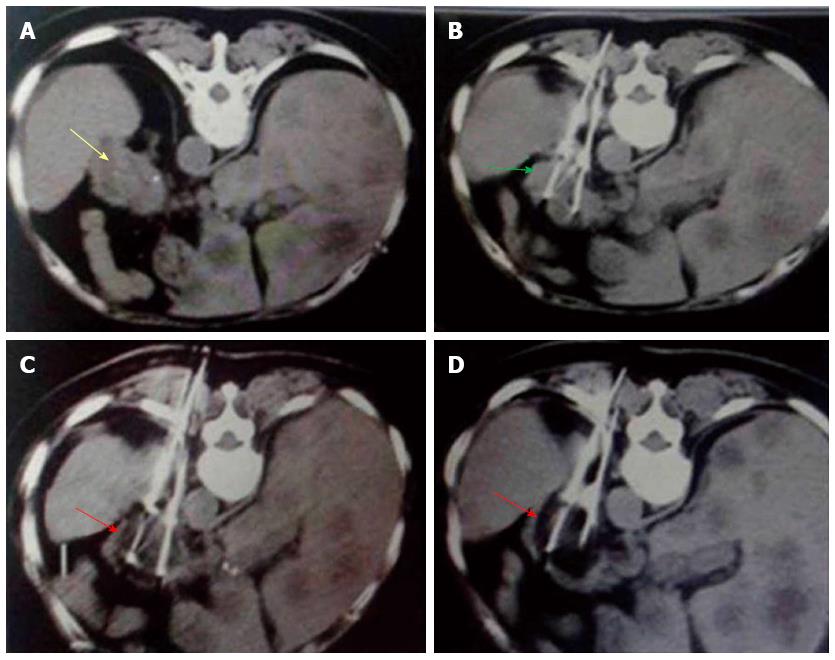
Figure 4 Percutaneous cryoablation of pancreatic cancer under enhanced computed tomography guidance.
The images represent transdorsal approaches. A: The tumor at the head of the pancreas can be seen with high intensity (yellow arrow); B: The probe (green arrow) was inserted percutaneously into the tumor via a transdorsal approach; C: Ice ball formation appears as a dark area (red arrow); D: The size of the ice ball covers the entire area of tumor.
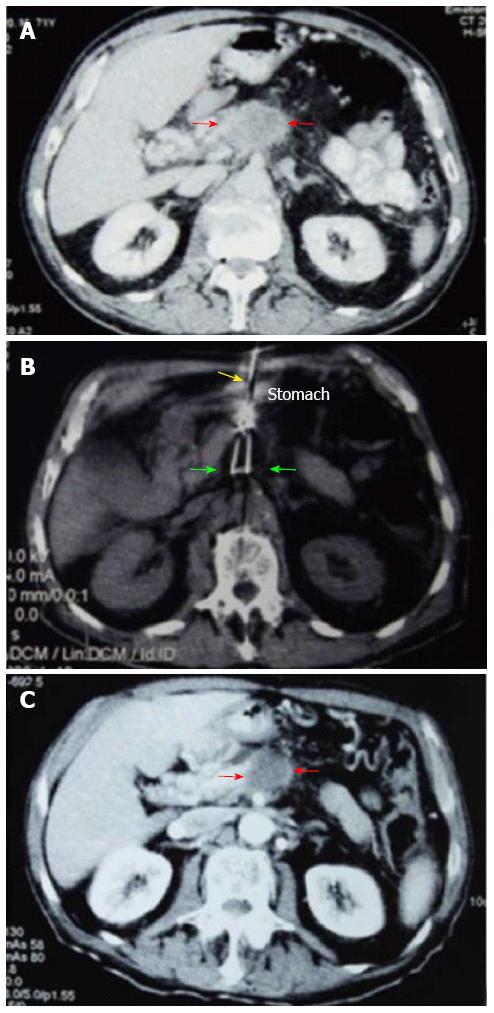
Figure 5 Comparisons between computed tomography images of pancreatic carcinoma before, during and 1.
5 mo after cryoablation. A: The tumor at stage IV (red arrows) is 4.5 cm × 4.6 cm × 3.8 cm in size; B: The cryoprobe was inserted via the stomach approaching the tumor mass (yellow arrow); cryoablation was performed after the pancreatic tumor was completely encased within the ice ball (green arrows); C: The center of the tumor mass (red arrows) 1.5 mo post-cryoablation displays shrinkage with no enhancement of the tumor.
Figure 6 Pancreatic computed tomography scans before and after cryosurgery combined with 125-iodine seed implantation.
A: Pancreatic lesions before treatment; B: Shrinkage of the pancreatic tumor one month post-treatment; C: Total shrinkage of the pancreatic tumor 6 mo post-treatment.
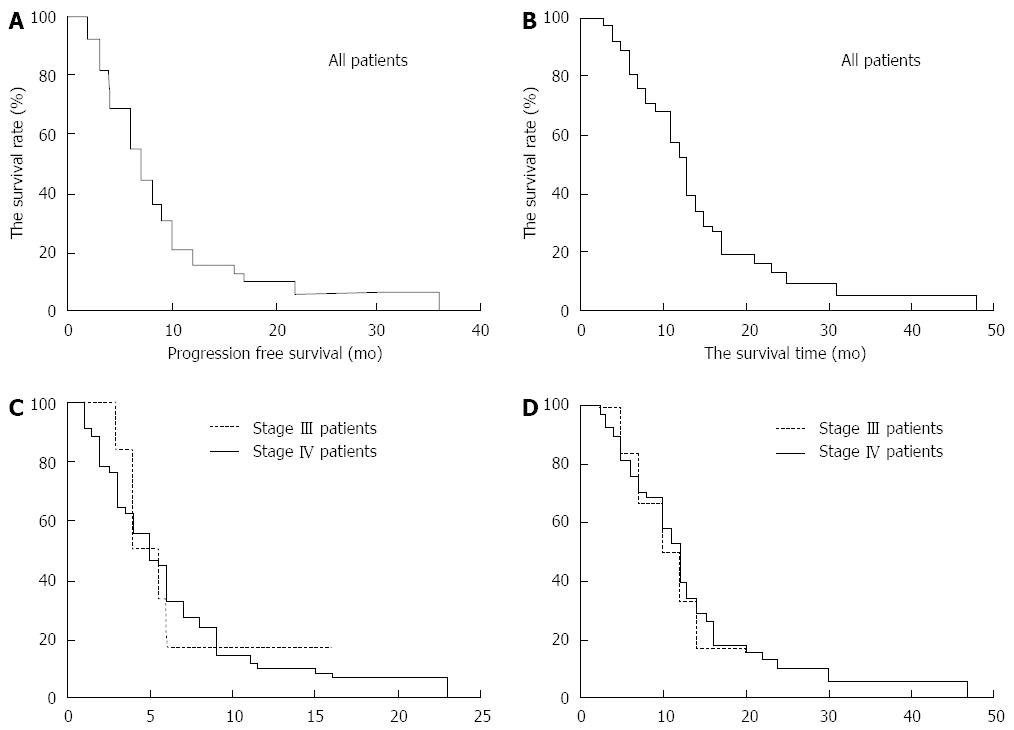
Figure 7 Survival plots of 67 patients with advanced pancreatic cancer after percutaneous cryoablation combined with 125-iodine seed implantation and chemotherapy.
A: Progression-free survival curves for all 67 patients following treatment; B: Overall survival curves for all 67 patients following the combined treatment; C: Progression-free survival curves for patients with stages III and IV advanced pancreatic cancer post-treatment; D: Overall survival curves for patients with stages III and IV advanced pancreatic cancer post-treatment.
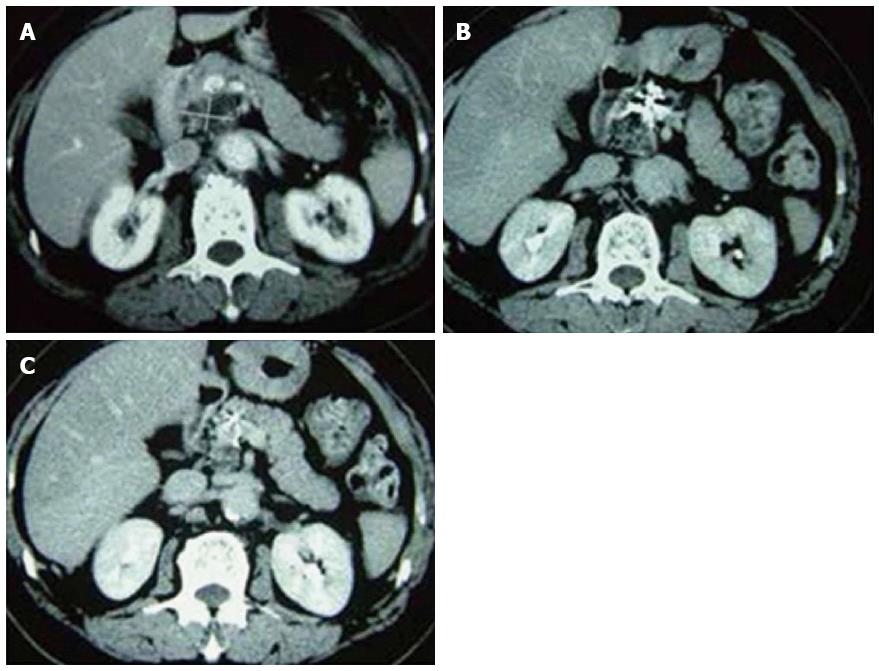
Figure 8 Pancreatic computed tomography scans of patients who received cryosurgery combined with 125-iodine seed implantation before and after treatment.
A: Before treatment; B: 3 mo post-treatment; C: 12 mo post-treatment.
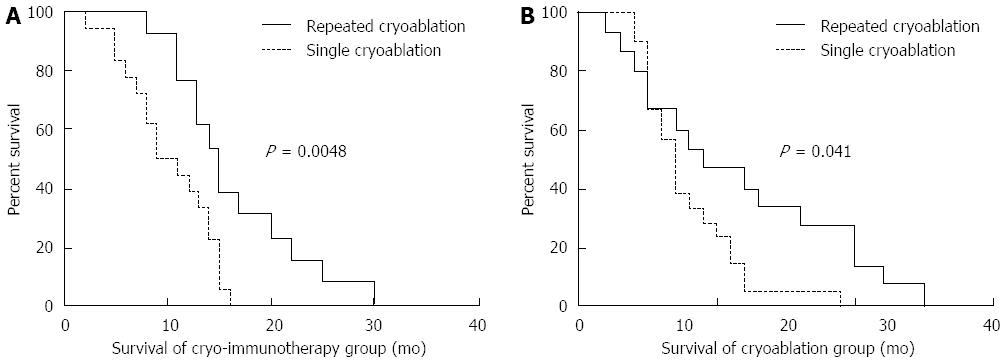
Figure 9 Correlation between overall survival and the number of cryoablation treatments in patients with pancreatic cancer.
A: Comparisons of overall survival in the cryoimmunotherapy group between 13 patients who underwent repeated cryoablation and 18 patients who received a single cryoablation procedure; B: Comparisons of overall survival in the cryotherapy group between 15 patients who underwent repeated cryoablation and 21 patients who underwent a single cryoablation procedure. The analyses were performed by the Kaplan-Meier method with long-rank tests.
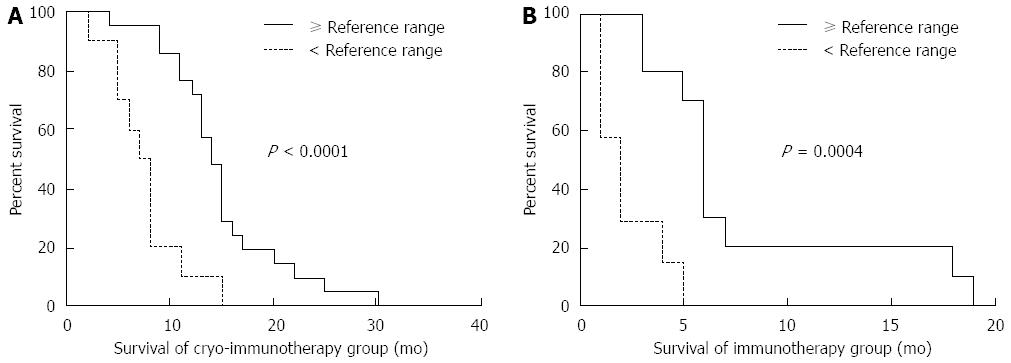
Figure 10 Correlation of overall survival with pretreatment immunologic indexes.
A: Comparison between overall survival in 21 patients with immunologic indexes ≥ the reference range and 10 patients with immunologic indexes < the reference range in the cryoimmunotherapy group; B: Comparison between overall survival in 10 patients with immunologic indexes ≥ the reference range and 7 patients with immunologic indexes < the reference range in the immunotherapy group. The analyses were performed by the Kaplan-Meier method with long-rank tests.
- Citation: Luo XM, Niu LZ, Chen JB, Xu KC. Advances in cryoablation for pancreatic cancer. World J Gastroenterol 2016; 22(2): 790-800
- URL: https://www.wjgnet.com/1007-9327/full/v22/i2/790.htm
- DOI: https://dx.doi.org/10.3748/wjg.v22.i2.790


