Copyright
©The Author(s) 2016.
World J Gastroenterol. May 14, 2016; 22(18): 4538-4546
Published online May 14, 2016. doi: 10.3748/wjg.v22.i18.4538
Published online May 14, 2016. doi: 10.3748/wjg.v22.i18.4538
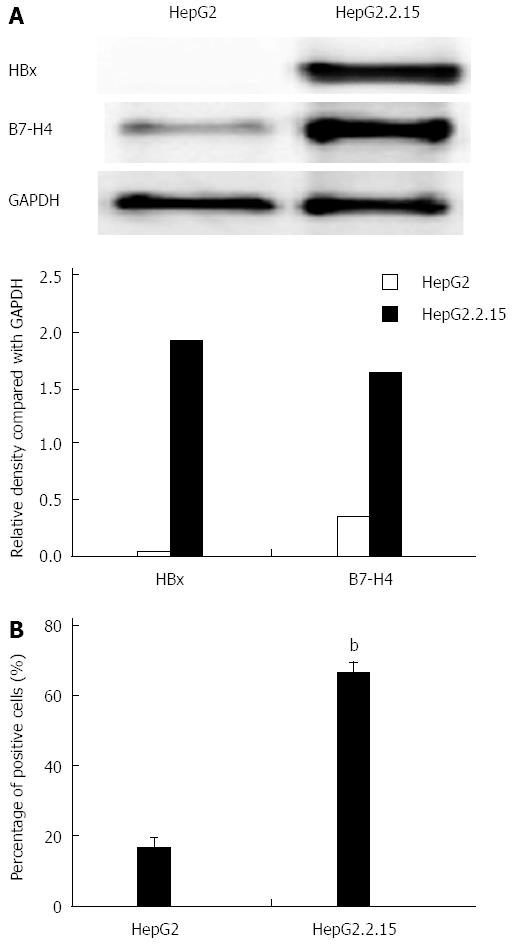
Figure 1 Expression of B7-H4 in HepG2 and HepG2.
2.15 cells. A: Detection of B7-H4 expression by western blot. The expression level of B7-H4 and HBx was shown by the relative density ratio of B7-H4 and GAPDH; B: Detection of B7-H4 expression by flow cytometry. bP < 0.01, HepG2.2.15 vs HepG2 cells. HBx: Hepatitis B virus X; GAPDH: Reduced glyceraldehyde-phosphate dehydrogenase.
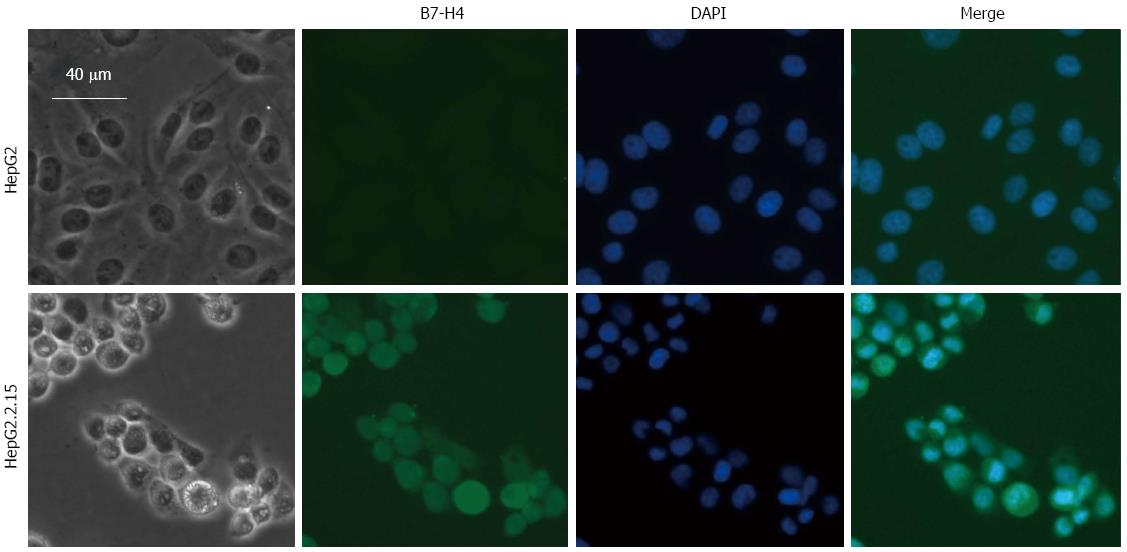
Figure 2 Expression of B7-H4 in HepG2 and HepG2.
2.15 cells determined by immunofluorescence staining. Immunofluorescence detection of B7-H4 in HepG2 and HepG2.2.15 cells was stained with 3E8 mAb followed with Alexa Fluor® 488 goat anti-mouse IgM antibody (green). Nuclei were stained with DAPI (blue). Changes in cell morphology were recorded with a light microscope at 200 × magnification.
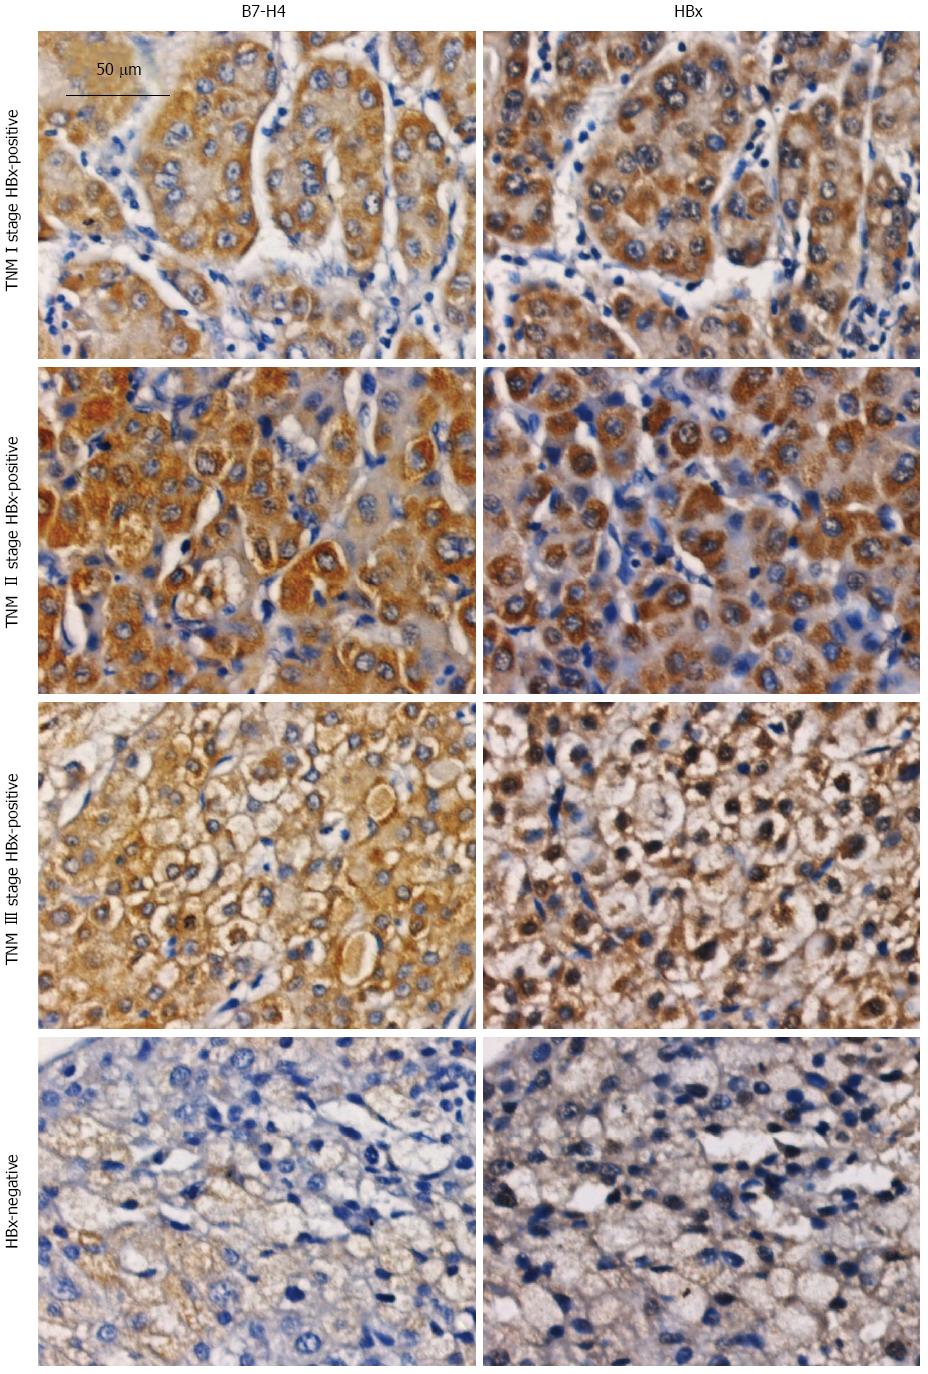
Figure 3 Expression of B7-H4 and hepatitis B virus X in hepatitis B virus related hepatocellular carcinoma tissues detected by immunohistochemical staining.
Paraffin sections were generated from 83 hepatitis B virus related hepatocellular carcinoma (HBV-HCC) patients (22 females and 61 males) were enrolled in this study. The age of these patients ranged from 35 to 77 years, with an average of 52.5 ± 11.3 years. HBV-HCC tissues were subjected to IHC staining using antibodies specific for B7-H4 and HBx and recorded with a light microscope at 200 × magnification. HBx: Hepatitis B virus X; IHC: Immunohistochemical.
- Citation: Hong B, Qian Y, Zhang H, Sang YW, Cheng LF, Wang Q, Gao S, Zheng M, Yao HP. Expression of B7-H4 and hepatitis B virus X in hepatitis B virus-related hepatocellular carcinoma. World J Gastroenterol 2016; 22(18): 4538-4546
- URL: https://www.wjgnet.com/1007-9327/full/v22/i18/4538.htm
- DOI: https://dx.doi.org/10.3748/wjg.v22.i18.4538


