Copyright
©The Author(s) 2016.
World J Gastroenterol. May 14, 2016; 22(18): 4484-4500
Published online May 14, 2016. doi: 10.3748/wjg.v22.i18.4484
Published online May 14, 2016. doi: 10.3748/wjg.v22.i18.4484
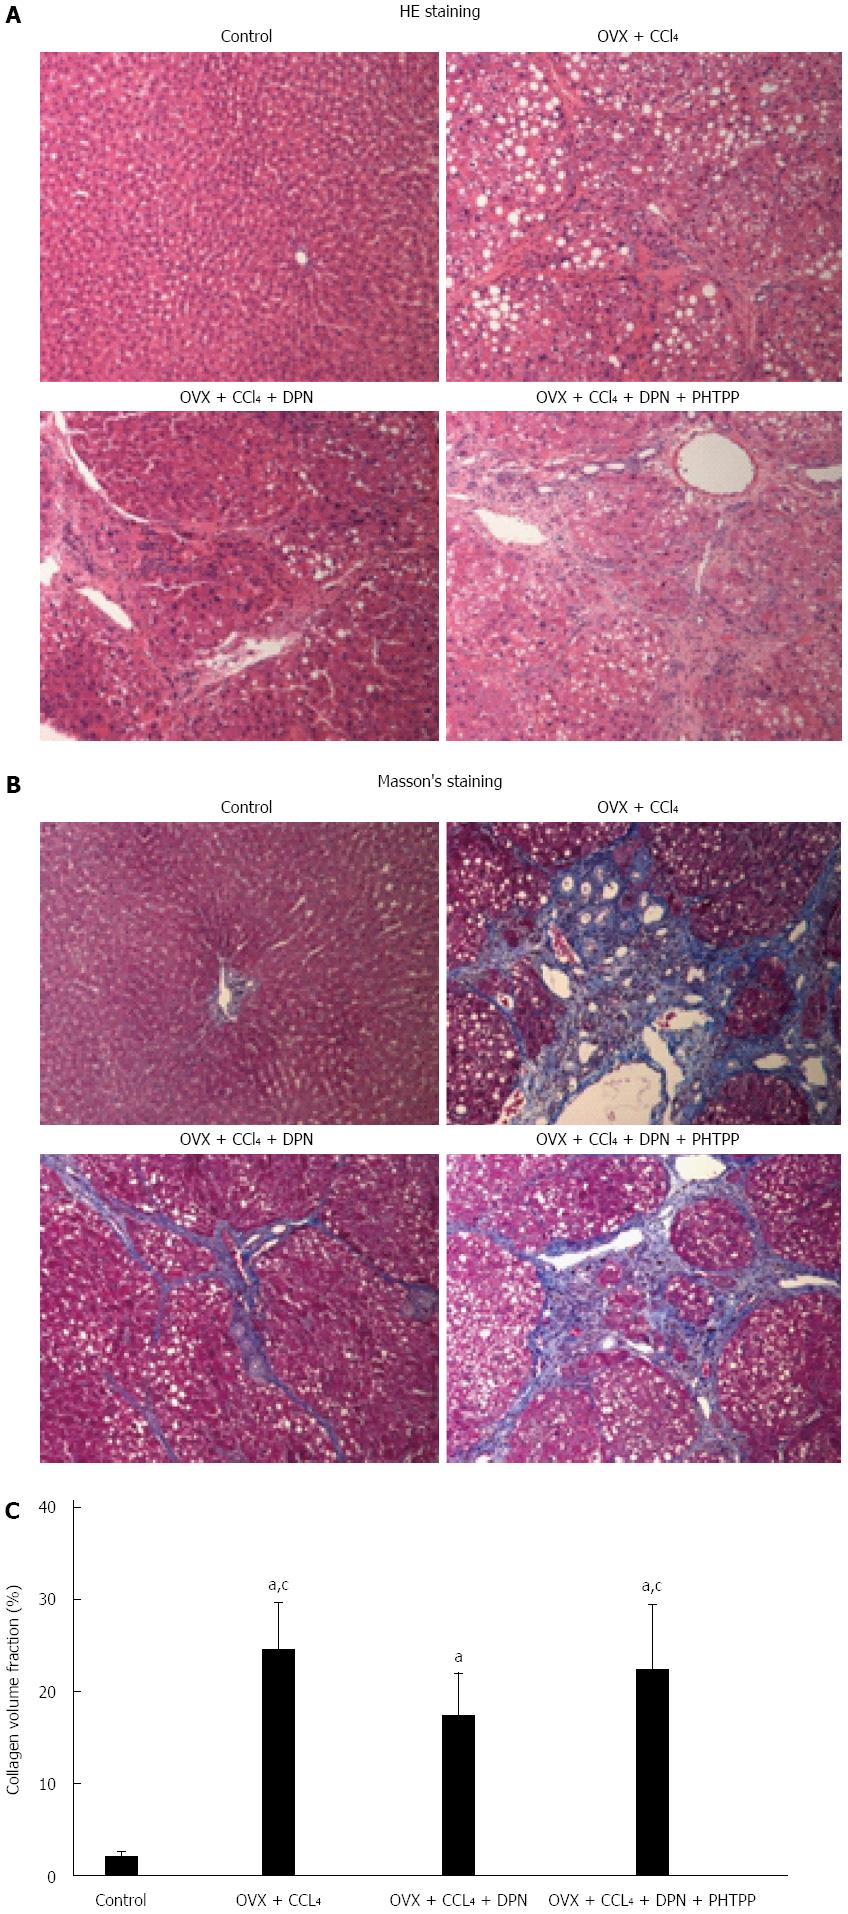
Figure 1 Therapeutic effects of diarylpropionitrile on hepatic fibrosis in CCl4-treated rats.
Histological images of rat livers stained with HE (A) or Masson’s staining (B) (magnification × 100) and semi-quantitative measurement of Masson’s staining (C). aP < 0.05 vs control group; cP < 0.05 vs DPN group. DPN: Diarylpropionitrile.
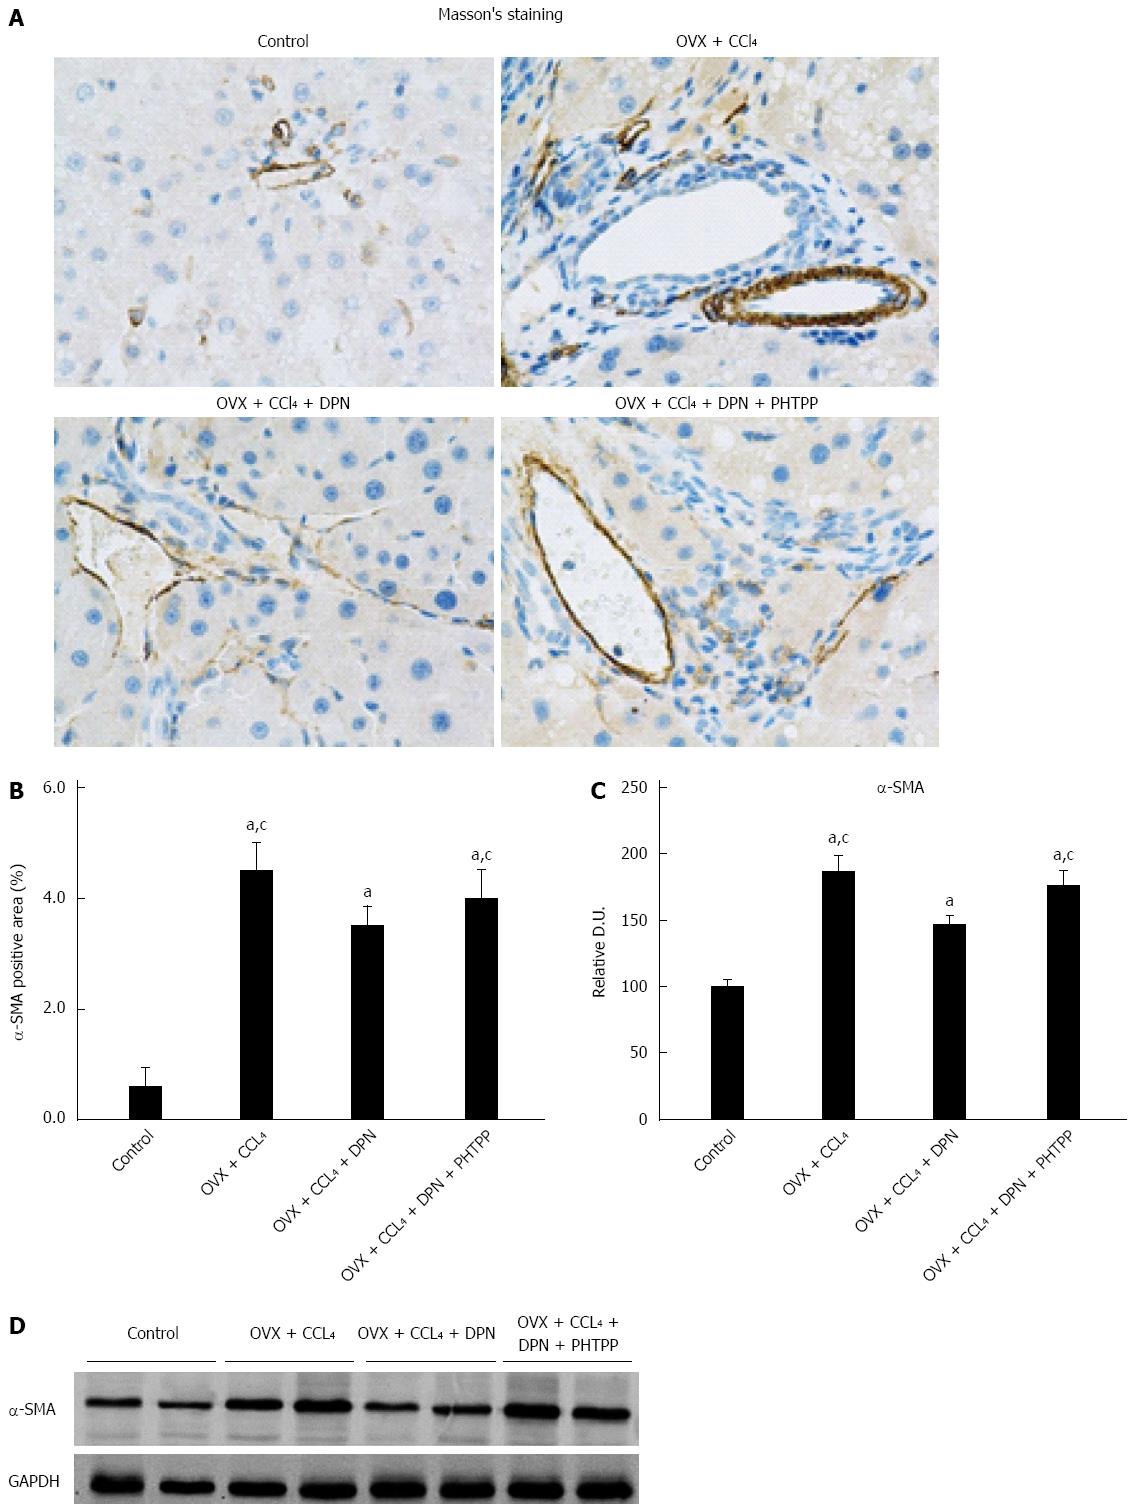
Figure 2 Diarylpropionitrile downregulates α-SMA expression in the livers of CCl4-treated rats.
A and B: Immunohistochemical staining for α-SMA (magnification × 400); C and D: Analysis of α-SMA protein expression by Western blot (each group n = 5). aP < 0.05 vs control group; cP < 0.05 vs DPN group. DPN: Diarylpropionitrile.
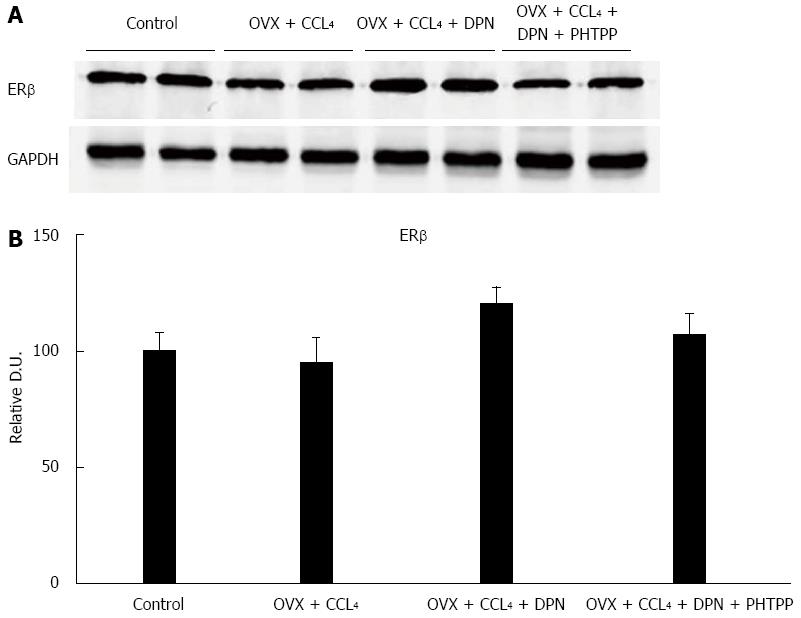
Figure 3 There were no statistically significant differences between the hepatic estrogen receptor β protein expression levels of all groups, as determined by Western blot analysis (A-B) (each group n = 5).
aP < 0.05 vs control group; cP < 0.05 vs DPN group. DPN: Diarylpropionitrile; ERβ: Estrogen receptor β.
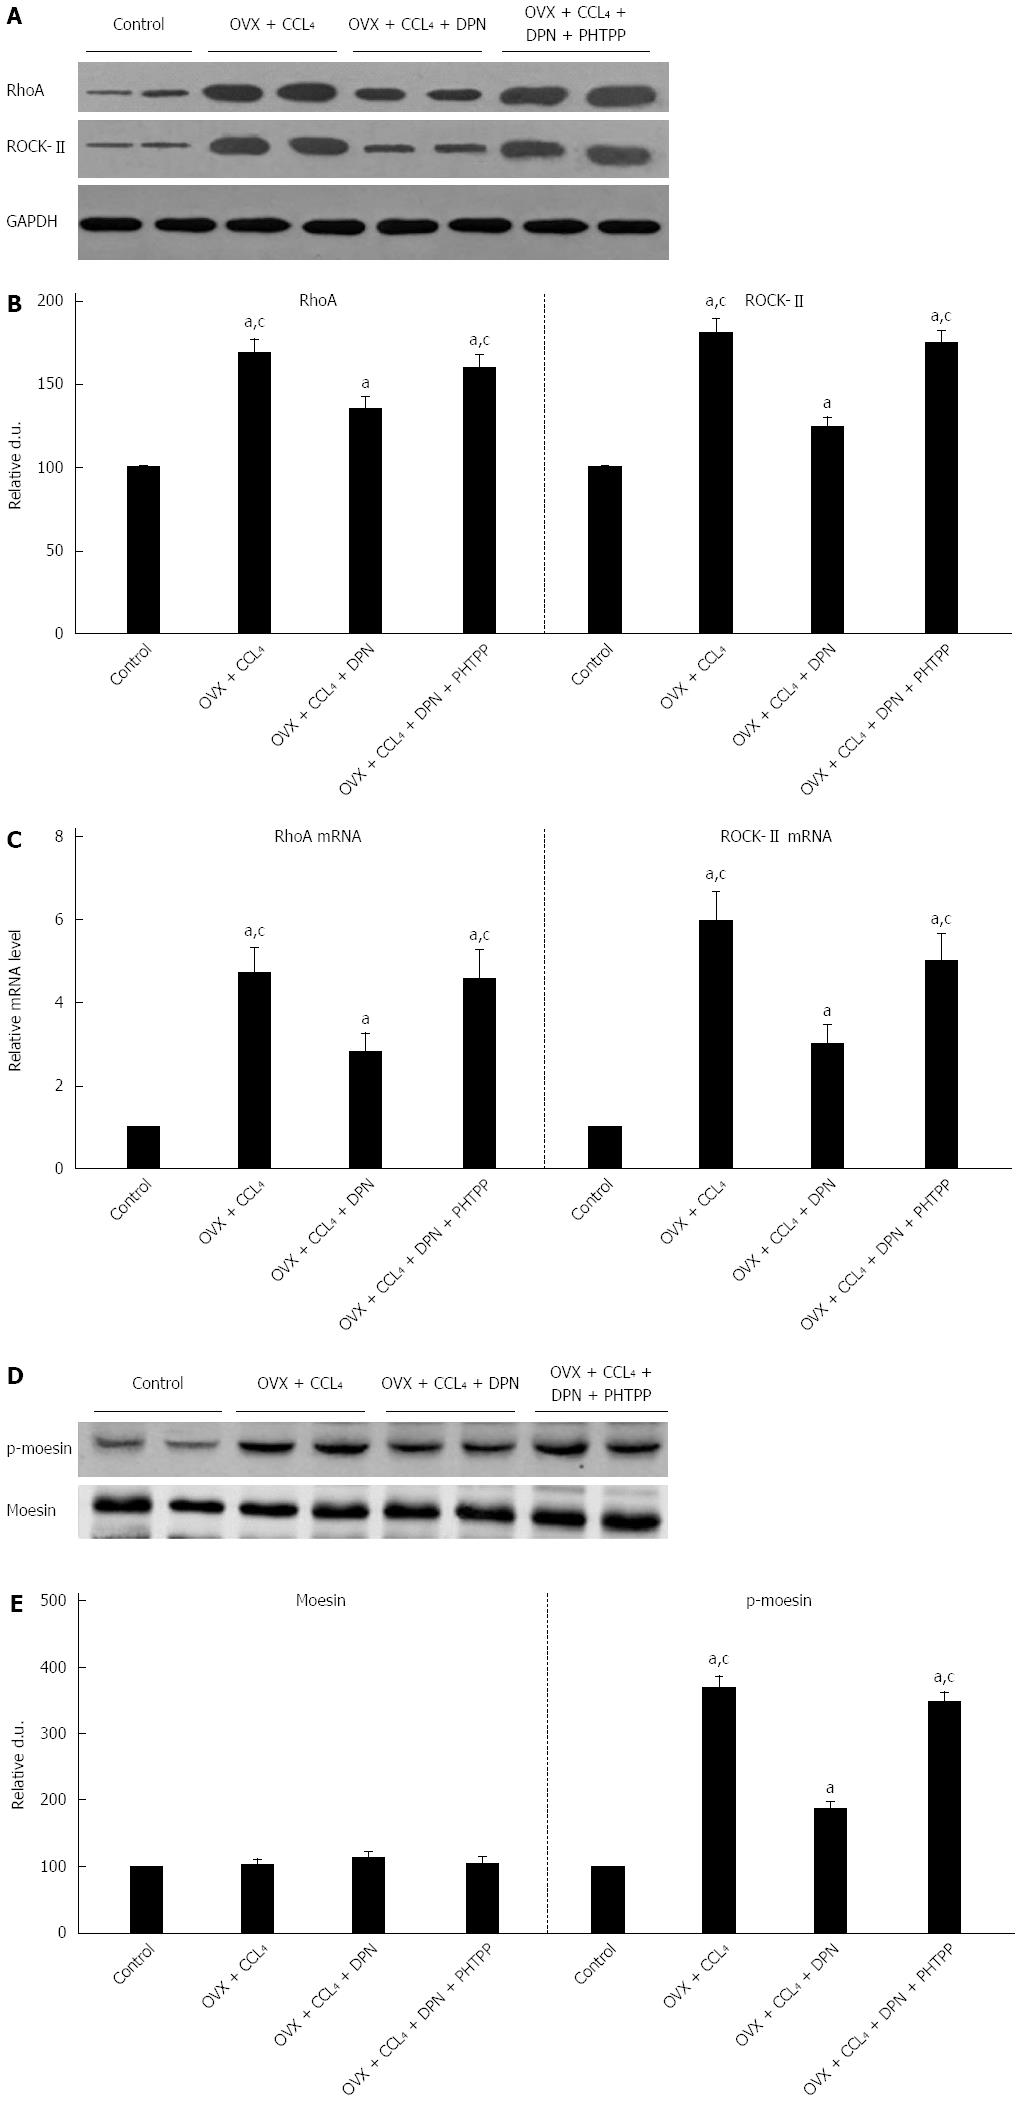
Figure 4 Diarylpropionitrile inhibits the protein (A, B) and mRNA (C, D) expression of RhoA and ROCKII, and even suppresses the site-specific phosphorylation of moesin (Thr558) in CCl4-treated rats (D, E).
Shown are the relative densitometric quantifications of all experiments (mean ± SE), with values from the sham-operated controls set to 100 DU. aP < 0.05 vs control group; cP < 0.05 vs DPN group. DPN: Diarylpropionitrile.
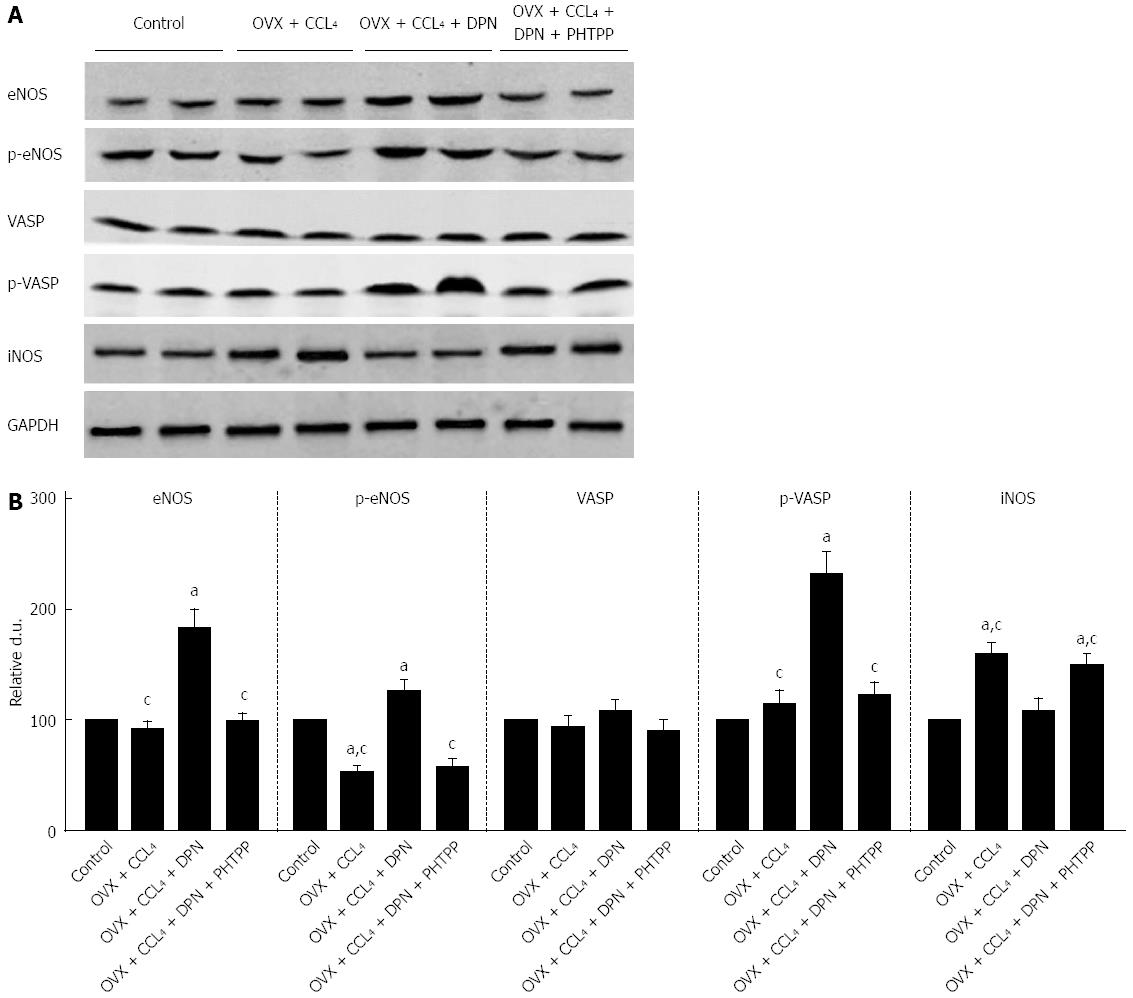
Figure 5 Diarylpropionitrile increases the hepatic expression of NO/PKG pathway proteins and increases their activity but inhibits hepatic iNOS expression in CCl4-treated rats.
A: Western blot analysis of eNOS, p-eNOS, VASP, p-VASP, and iNOS protein expression; B: Relative densitometric quantifications of all experiments (mean ± SE), with the values from the controls set to 100 DU (each group n = 5). aP < 0.05 vs control group; cP < 0.05 vs DPN group.
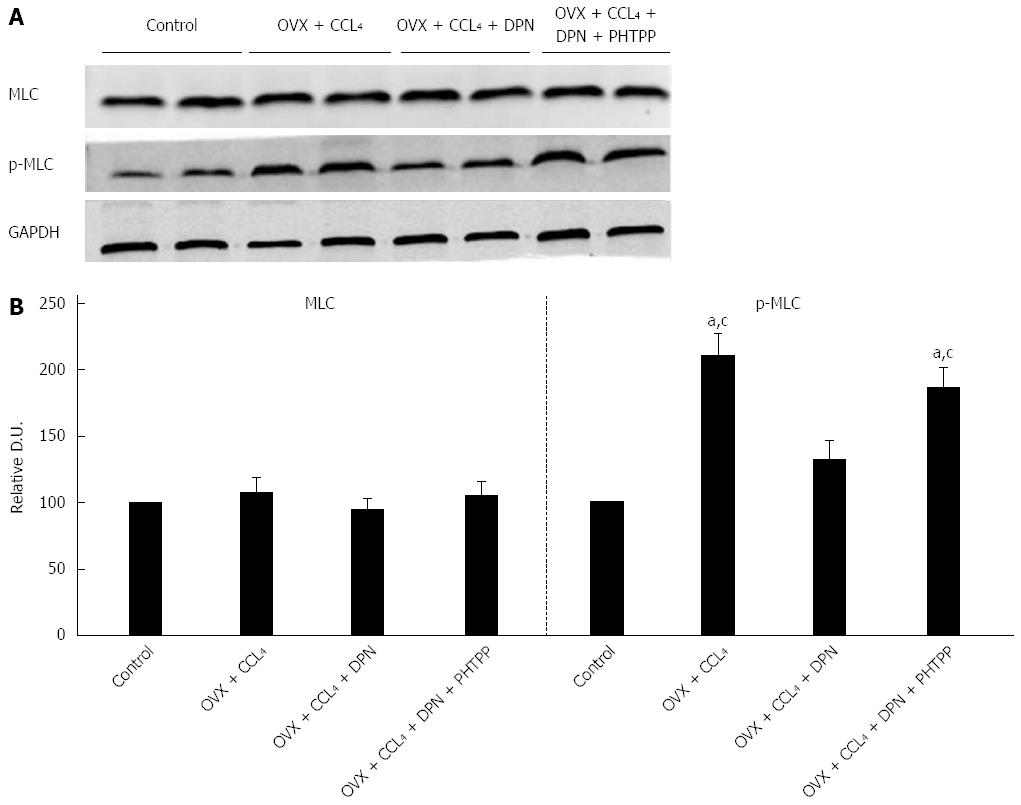
Figure 6 Diarylpropionitrile inhibits the phosphorylation of MLC in the livers of CCl4-treated rats.
A: Western blot analysis of total MLC and p-MLC; B: Relative densitometric quantifications of all experiments (mean ± SE), with the values of the controls set to 100 DU (each group n = 5) aP < 0.05 vs control group; cP < 0.05 vs DPN group. DPN: Diarylpropionitrile.
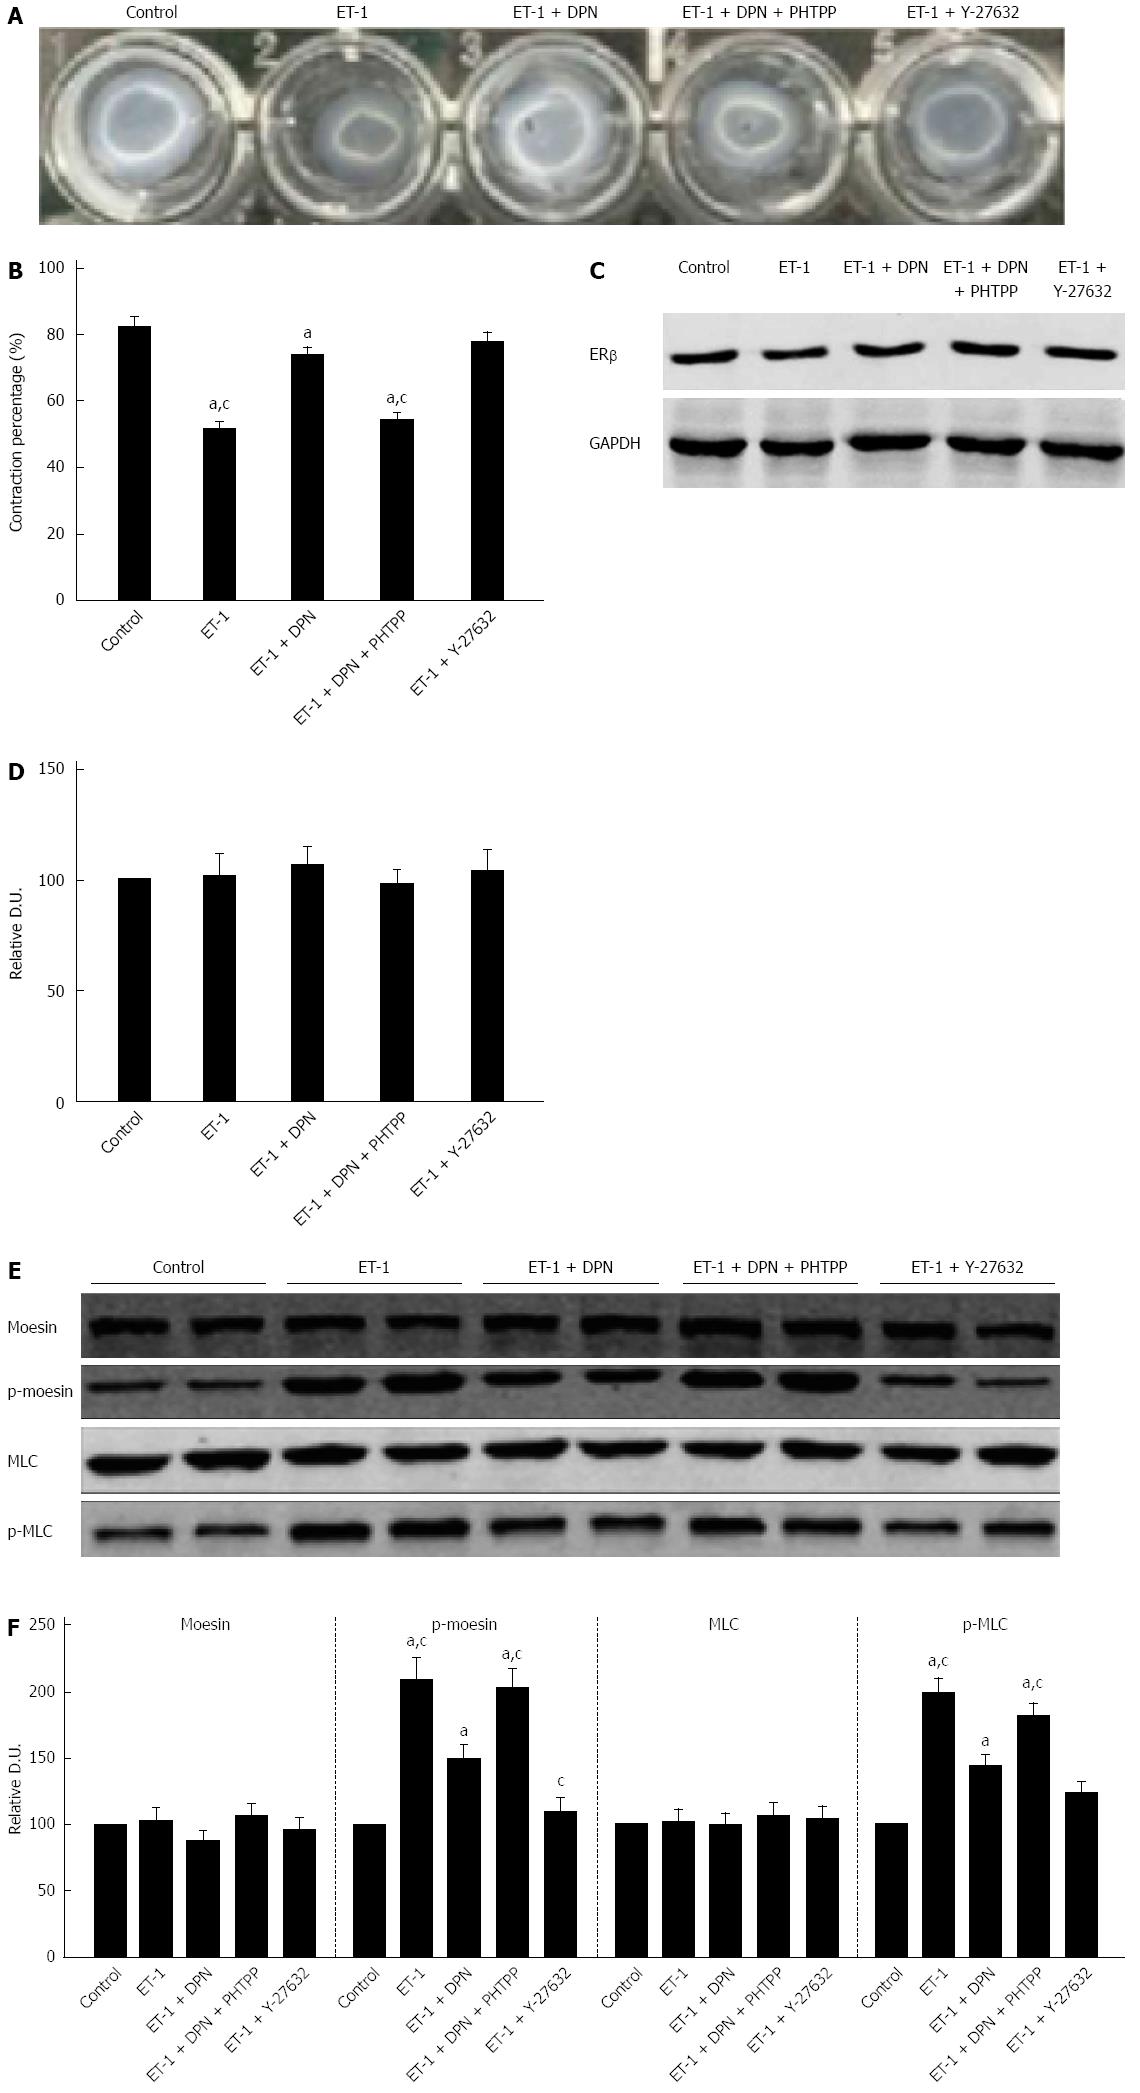
Figure 7 Diarylpropionitrile inhibits collagen lattice contraction in hepatic stellate cells and decreases ET-1 induced moesin and MLC phosphorylation.
A: Appearance of collagen lattices 4 h after drug treatment; B: The percentage of remaining lattice area 4 h after drug treatment (each group n = 12); C, D: Western blot analysis of ERβ protein expression in hepatic stellate cells (HSCs) (each group n = 5); E: Western blot analysis of the total and phosphorylated moesin and MLC in HSCs; F: Relative densitometric quantifications of moesin and MLC experiments (mean ± SE), with the values of the controls set to 100 DU (each group n = 5). aP < 0.05 vs control group; cP < 0.05 vs DPN group. OVX: ovariectomized; SVR: Systemic vascular resistance; DPN: Diarylpropionitrile.
- Citation: Zhang CG, Zhang B, Deng WS, Duan M, Chen W, Wu ZY. Role of estrogen receptor β selective agonist in ameliorating portal hypertension in rats with CCl4-induced liver cirrhosis. World J Gastroenterol 2016; 22(18): 4484-4500
- URL: https://www.wjgnet.com/1007-9327/full/v22/i18/4484.htm
- DOI: https://dx.doi.org/10.3748/wjg.v22.i18.4484


